Overview
Reports can be accessed from the sales document header Print function, viewed from the Report Manager, and edited in the Report Designer (Modules > Report Manager (under System)> (select a report) > Design).
Note: In SalesPad Versions 4.1 and later, users should be able to save as usual with no issue.
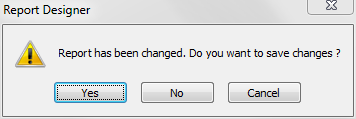
For Versions prior to 4.1: Due to an issue beyond SalesPad’s control (Report Designer is a Dev Express feature, not created by SalesPad), the Save button in the Report Designer may not always save your changes. To prevent losing reports and changes when closing a report, we recommend that instead of using the Save button, you always click the X in the top right corner of the Report Designer and click Yes when prompted to save:
When copying a report, you must make a change in order to be prompted to save. In this case, the simplest way is to move something by clicking on an element, clicking the right arrow, then clicking the left arrow to move it back. Then you can close the Report Designer and you will be prompted to save.
To view documentation on DevExpress's Report Designer, click here.
Security
Print Report and Report Manager must be enabled in the Security Editor (Modules > Security Editor) to allow each function.
Under the Print Report security setting, Admin Mode should be set to True to enable report editing. To access a report from the Print dialog, you must first add the name of the report to the proper sub- setting (Invoice, Order, Quote, or Return). All other existing reports will be hidden. A blank field gives access to all reports for that document type. Unless the field is left blank, new reports and copies of reports edited in the Report Manager will not be visible until you add access in the Security Editor.
Use
Original reports cannot be edited in SalesPad. To make any changes, such as adding a company logo to customize a report, you must first make a copy:
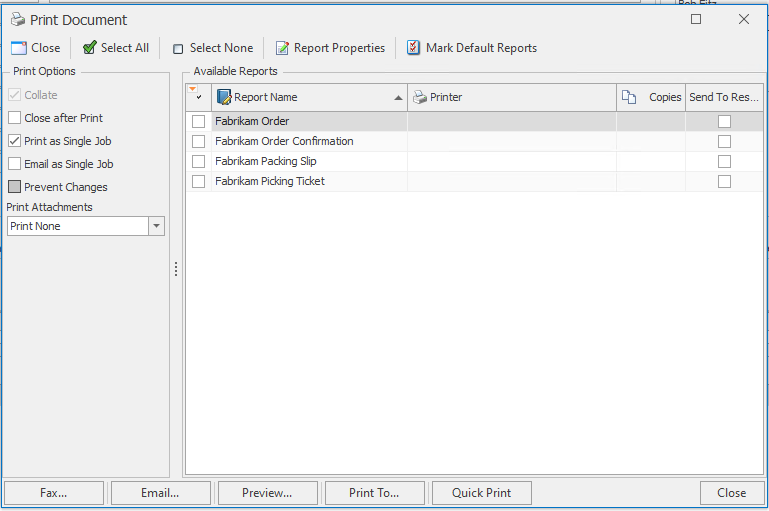
- On a sales document header, click Print. The "Print Sales Document Report" window appears
- Select the report to be copied
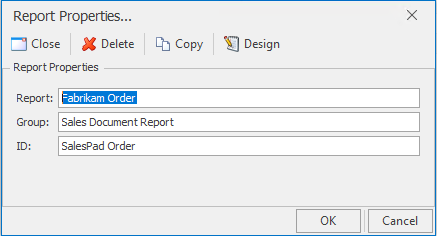
- Click Report Properties…. The "Report Properties" window appears
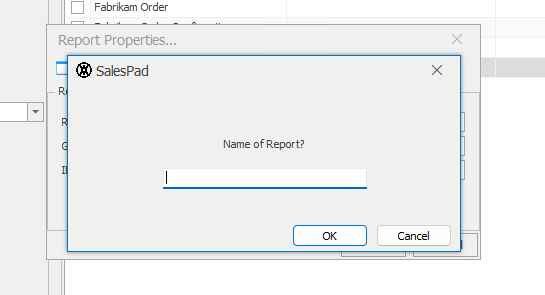
- Click Copy. The following message appears
- Click OK. Rename the report and click OK.
- When prompted to save changes, click Yes
These steps will create a default report with the same name and type as the one that is copied, but will not transfer over any changes that were made to it. In other words, the result will be an out-of-the-box, default report. To pull in changes and customizations from the original report that was copied, you must save the original to a .repx file and load it into the copy:
- Select the original report from the Print dialog
- Click Properties
- Click Design. The Report Designer opens
- Go to File > Save As… and enter a file name
- Click OK and close the Report Designer
- Repeat steps 1 through 3, selecting the new copy instead of the original
- Go to File > Open and open the .repx file. This will load the changes
- Save the copied report (if you are using a version prior to 4.1, see Note section on page one)
Report Designer Controls
- Controls can be resized via resize handles
- Controls can be moved via the handle at the top left corner or with the arrow keys
- Holding the Control key while moving will move the control in precision mode
- Controls have a task menu accessible via a small arrow on the top right corner
- Controls' properties can be set via the Property Grid in the lower right-hand corner of the screen
LABELS
Labels are the simplest controls, holding either text or a bound data field. Various options about the text can be set via the task menu.
TABLES
Tables consist of rows and columns, with text or bound data fields stored in cells. Cells belong primarily to rows, while columns exist solely to allow resizing cells that are stacked on top of one another. While tables share the same resizing and moving mechanics of labels, cells can only be resized horizontally— only rows and columns can be resized in all directions. Data bindings are set at the cell level.
Figure 1 - Table: Notice the resize handles to allow resizing the entire table. Notice that the cells have data bindings as shown by the text in [Brackets] and the yellow cylinder icon
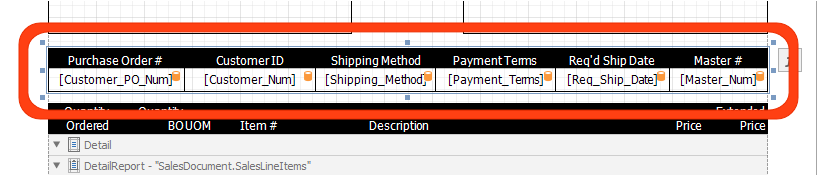
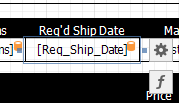
Figure 2 - Cell: Notice the resize handles that allow the cell to be resized horizontally.
Also notice the ⚙ which opens the Task Menu, or the ƒ to access the Expression Editor.
To ensure all cells are the exact same width and that they line up properly with their labels, select the row and the properties pane on the right-hand side of the window to display the width of the entire row. Divide it by the number of cells in the row and select each one individually, setting the width to the correct value.
IMAGES
Images are added in a Picture Box. This box is very similar to a label, except that the task menu contains an Image field that can be loaded with an image. Images can be added from a local or network path using the Image field, or from a website URL by using the Image URL field. The Image Sizing field allows the image scaling and aspect ratio to be set.

Note: Images are embedded in the report file so that a user on another machine can work with the report and see the image without loading it to a local file location. No file copying is required.
You can also design a report to pull an item’s designated image. Refer to: Printing Item Images onReports in SalesPad’s knowledge base.
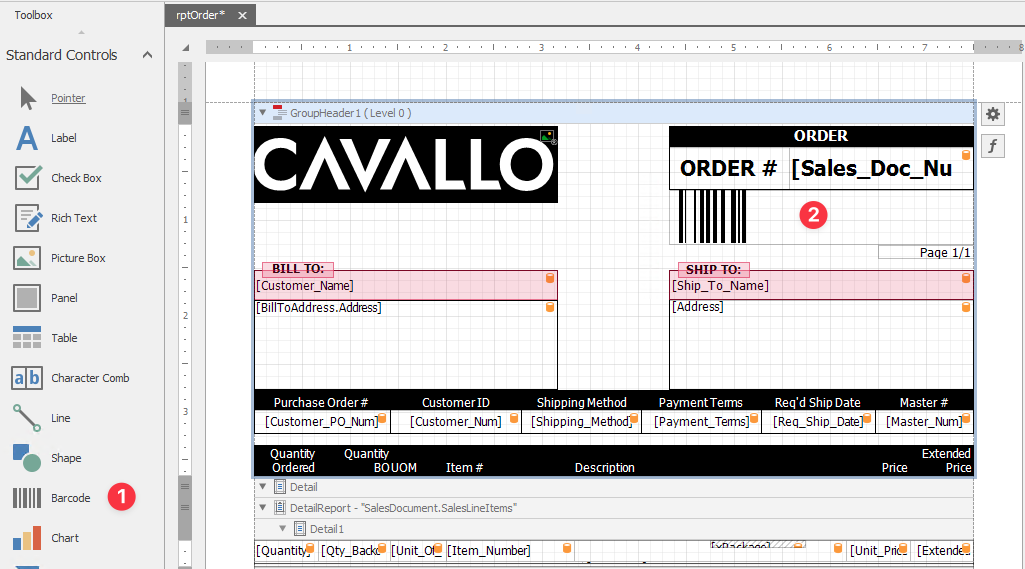
BAR CODES
Bar codes are similar to labels, except that the bound data field set via the task menu is encoded into a barcode in the chosen symbology. This symbology can be chosen via the Property Grid. Other options include the Module which can be adjusted via the task menu, which dictates the size of the bar code.
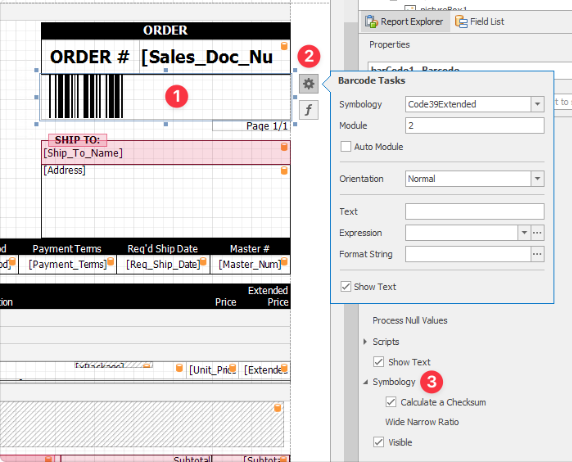
Drag and drop a Barcode control onto a Report to configure the barcode properties.
Note: Some barcode formats will add what’s called a checksum to the end of the standard text in the barcode, causing the barcode to print with an extra character. To turn this off, go to the Properties grid for the barcode, find Symbology and set Calculate a Checksum to No.
Note: For barcodes, SalesPad recommends using Code 128 as the barcode type – the symbology is cleaner and it is one of the most popular in the US. It also doesn't have a check digit for security to configure or disable.
Using Report Designer
- On the Print Sales Document Report window, select the report to be designed and click Properties (or go to Modules > Report Manager, select a report, click Design and skip step 2)
- On the Report Properties window, click Design
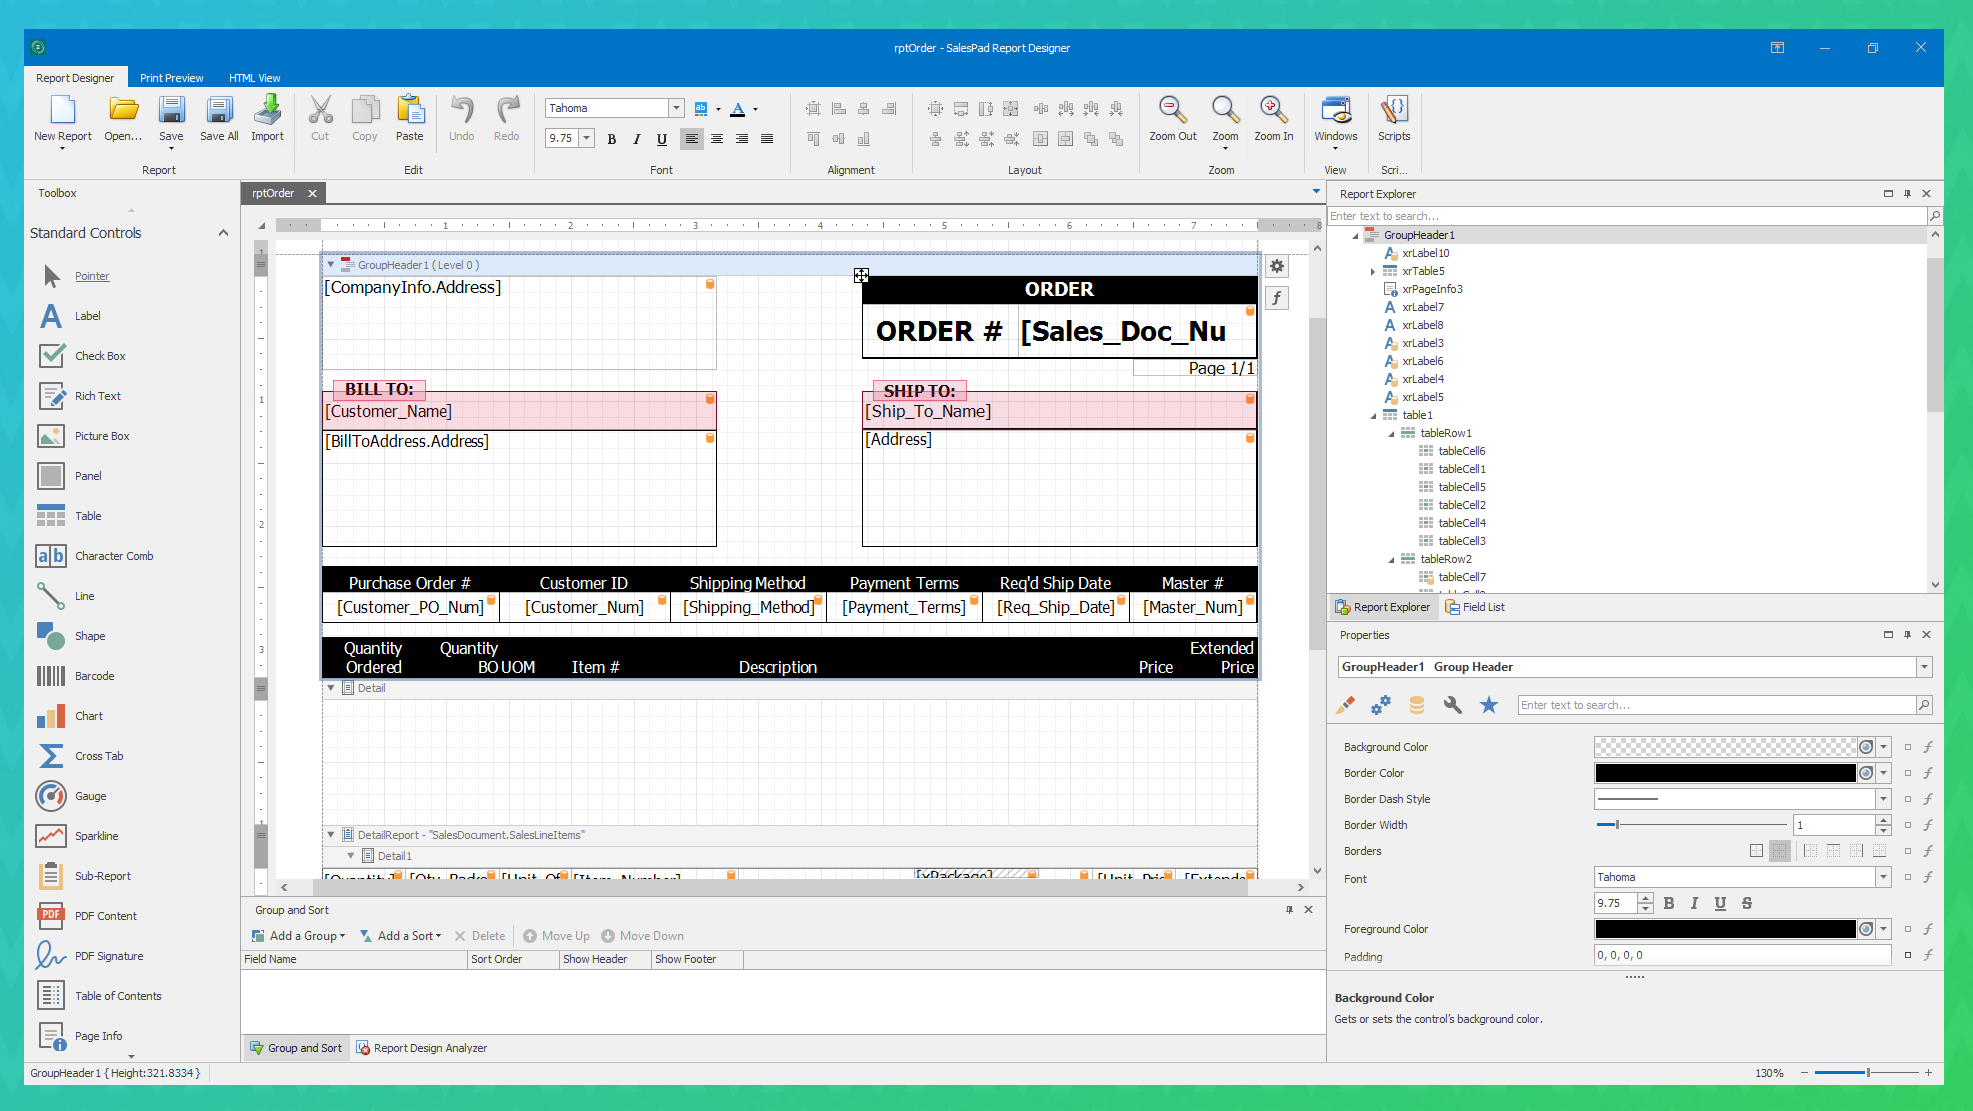
- The "Report Designer" window will open. Make design edits here:
- Once the edits are complete, if using version 4.1 or newer, click Save and then close. If using a version older than 4.1, click the X to close the Report Designer window. If changes were made, a prompt will appear asking if you want to save. Click Yes. (Refer to the note about versions prior to version 4.1)
- On the Report Properties window, click OK
- When prompted to save changes, click Yes
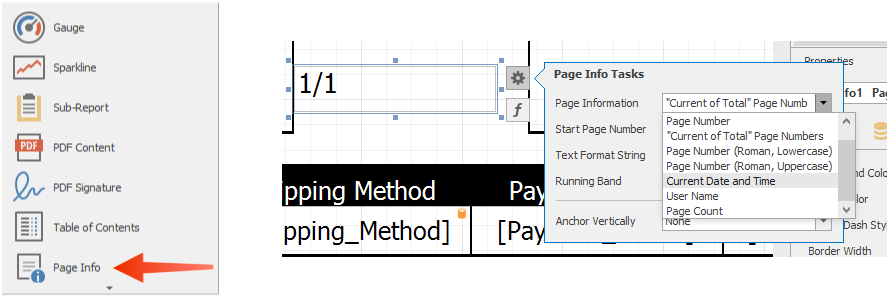
ADDING A DATE TO A REPORT
Add a Page Info field from the Standard Controls palette in the Tool Box on the left-hand side of the Report Designer. Once added, use the properties handle (>) to select the date/time option and a format.
RESPECTING LINE BREAKS
Line breaks added in the Report Designer will not necessarily print. To respect line breaks in a field (for example, an address field):
- Click on the field
- Click the (⚙) arrow to open the Tasks menu
- Make sure Multiline is checked

SORTING PRINT REPORT LINE ITEMS
Sorting Line Items by Sales Document Sequence
In sales documents, it is possible to insert new sales lines above those already existing, and the sequence will be maintained. But the line order won't necessarily be honored when printing (lines will print in the order they were added), unless the sorting is manually specified in the Report Designer:
- Open the Report Designer (Modules > Report Manager > (select a report) > Design) for an applicable report
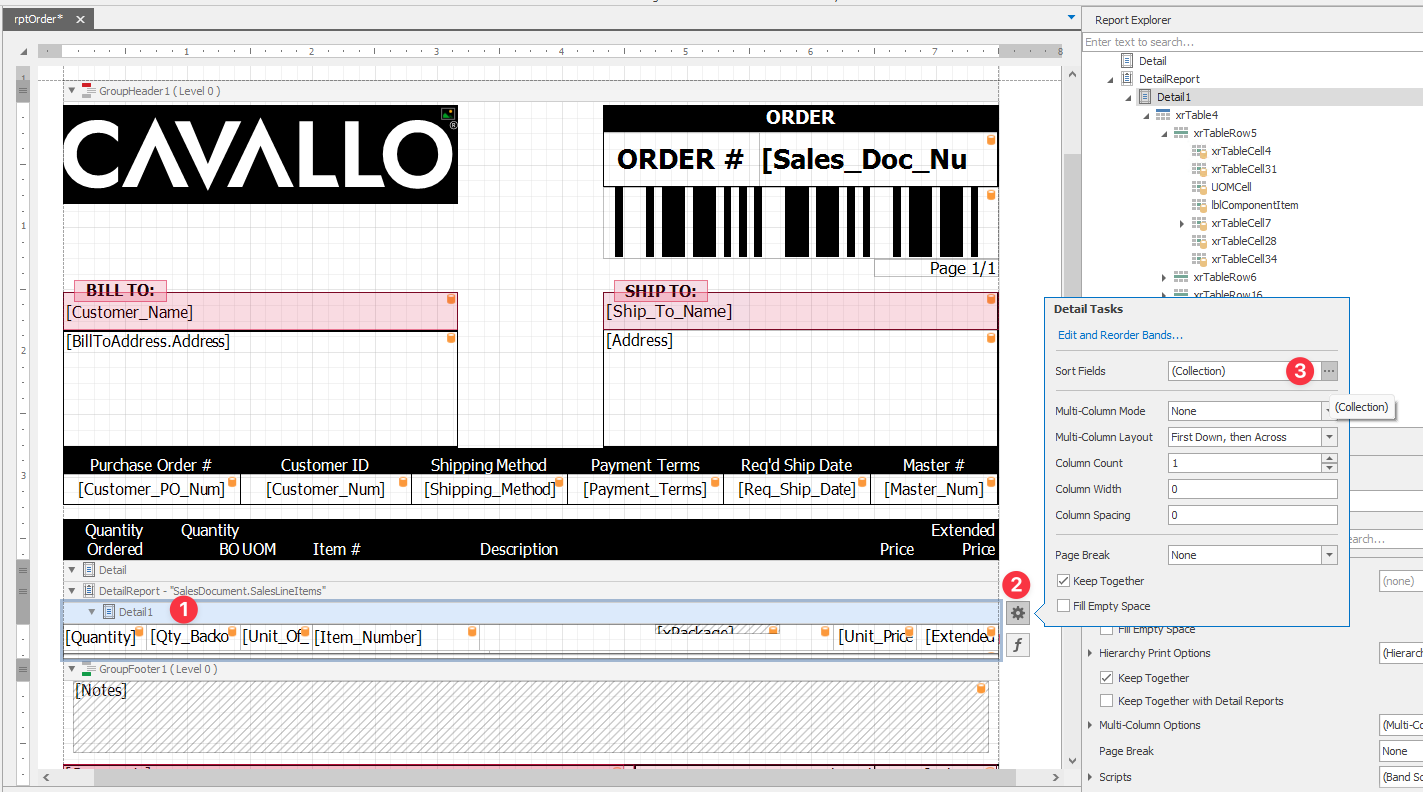
- Click on the Detail1 band, and then on the ⚙ to bring up the Tasks dropdown menu
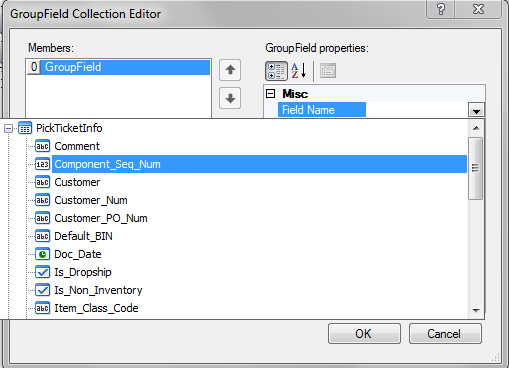
- Click the ellipsis (…) button next to Sort Fields. The "Group Field Collection Editor" window will appear
- Click Add to add a GroupField
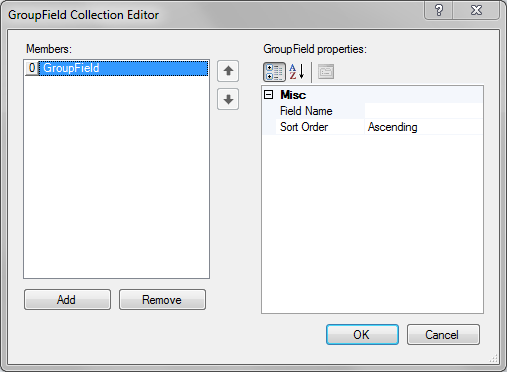
- Click on the Field Name in the GroupField properties and click the down arrow to display the dropdown
- Select Component_Seq_Num from the list
This will cause the line items to sort in the order that they display on the sales entry screen. Other sort orders can be defined, such as sorting by kit items, by choosing to bind to a different field.
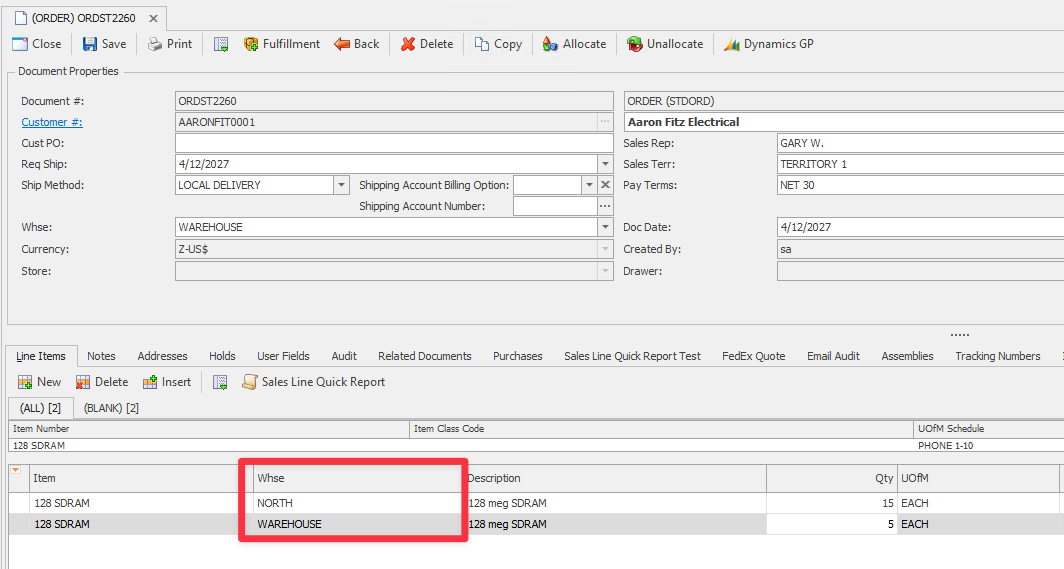
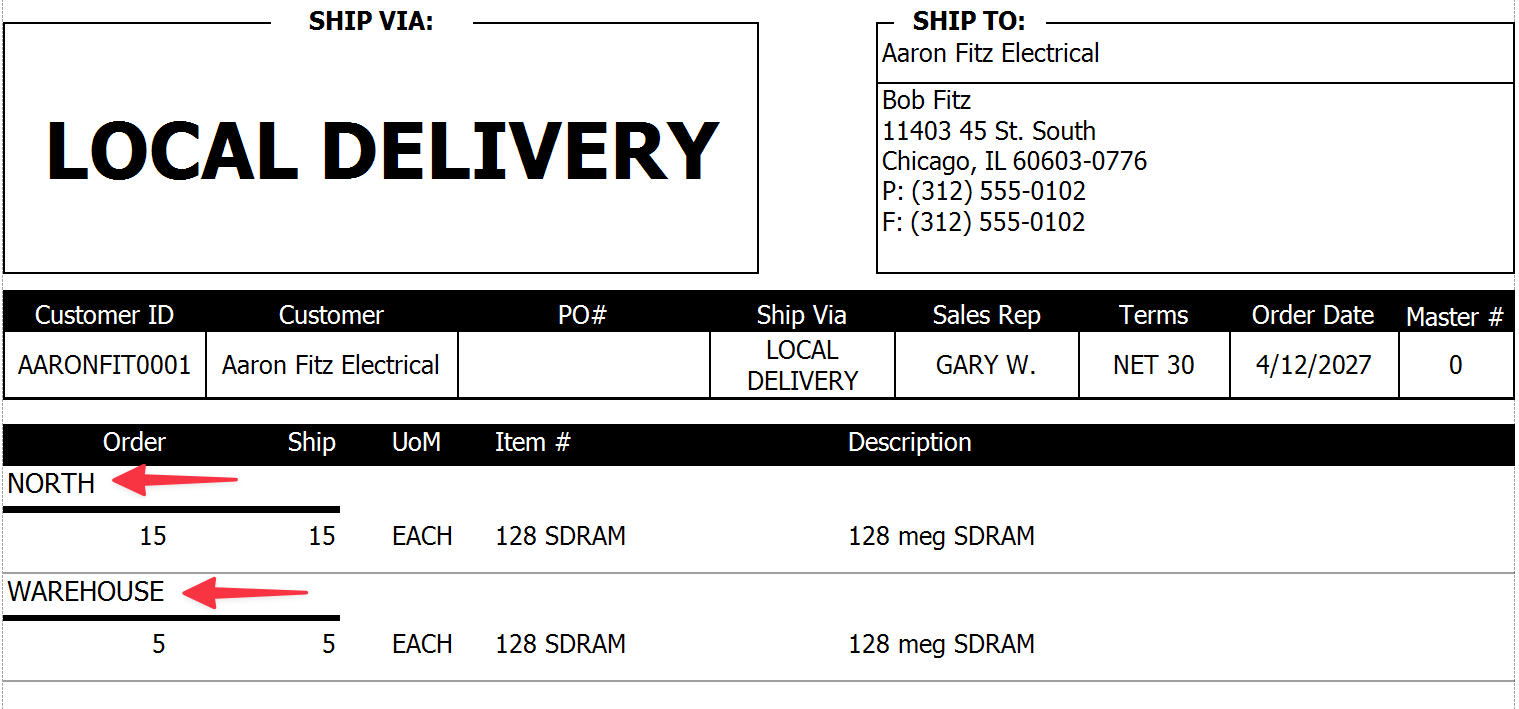
Grouping line items by warehouse in the picking ticket report
- Open your picking ticket in the Report Designer (Modules > Report Manager > (select picking ticket) > Report Designer
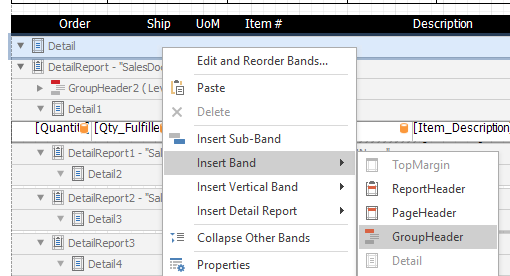
- Right-click on the band for your detail section and select Insert Band and then GroupHeader
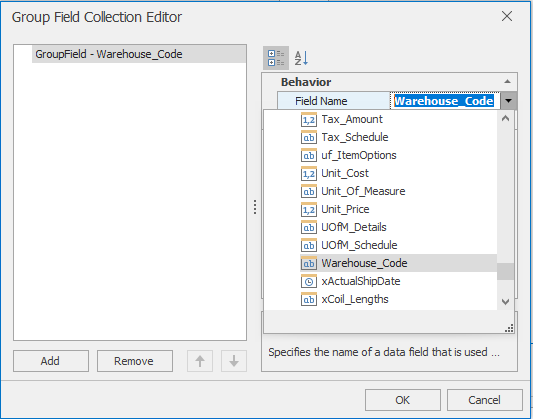
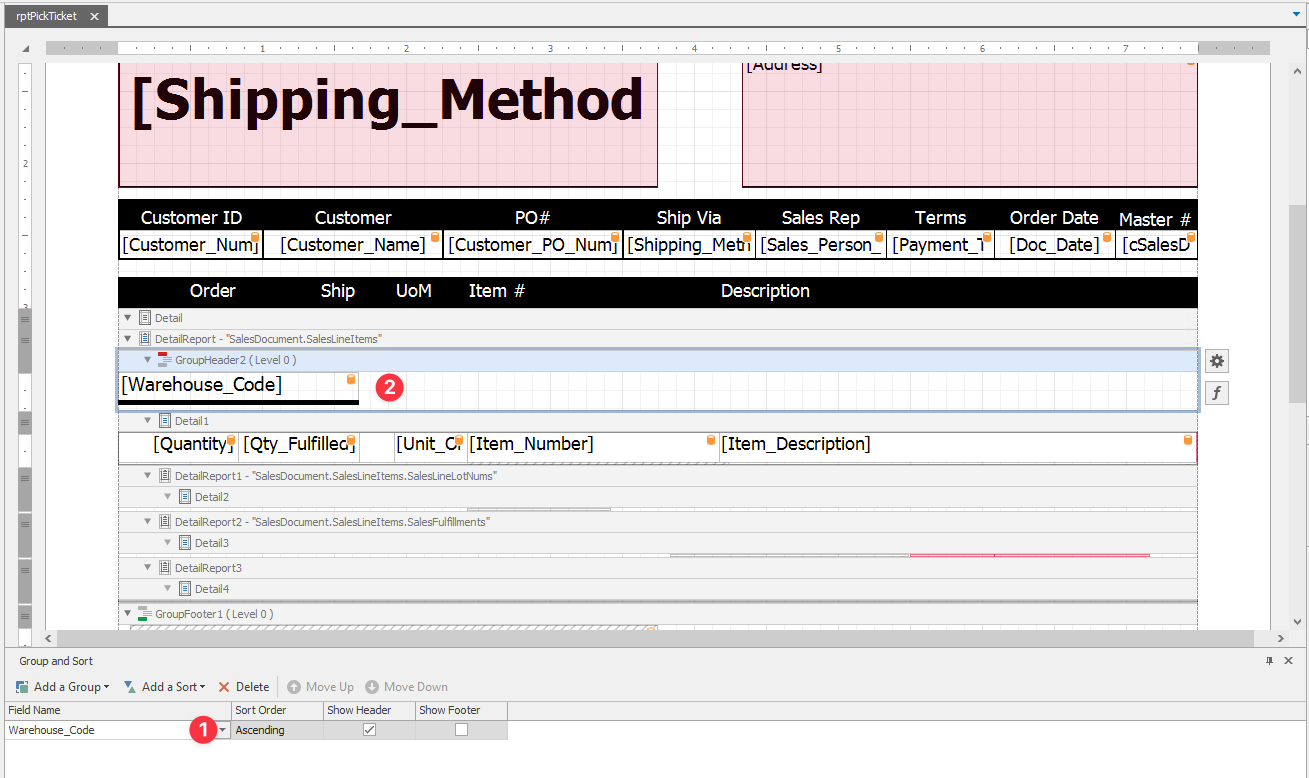
- Find Warehouse_Code under SalesLineItems in the Field List and drag it into the header
- Save and close Report Designer to return to Report Manager (see Note section on page 1).
Line items in the picking ticket will group by warehouse code.
ADDING CALCULATED FIELDS
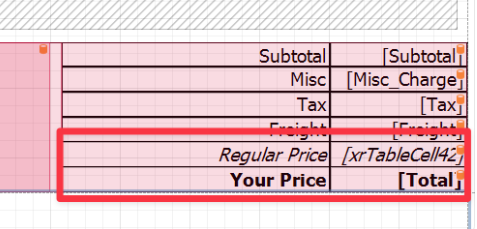
Calculated fields are used to show computed totals on reports. One example is a report that calculates and displays regular price and discount price:
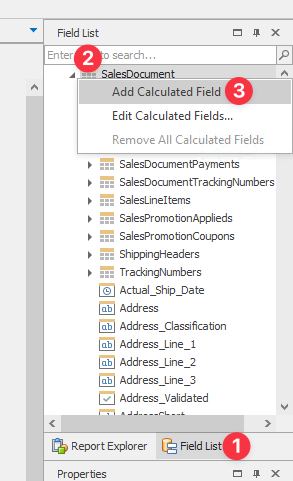
- In the Report Designer, go to the Field List
- Expand the SalesDocument list by clicking the ►
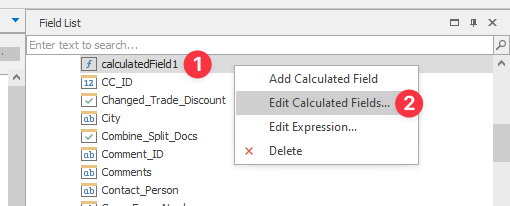
- Right-click on SalesDocument and select Add Calculated Field
- calculatedField1 will be added to the Field List.
Right-click it and select Edit Calculated Fields...
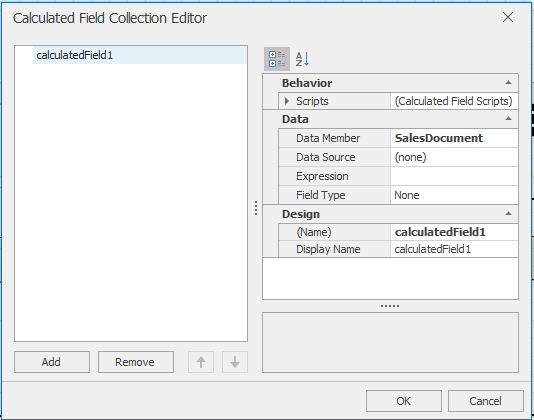
The CalculatedField Collection Editor screen appears:
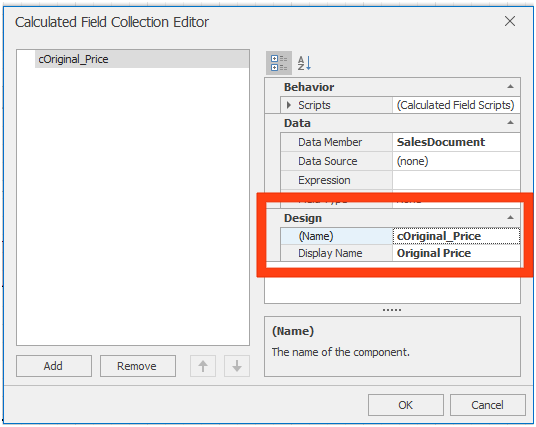
- On the right side, under Design, click calculatedField1 next to “(Name)” and change the name of the field (ex: cOriginal Price).
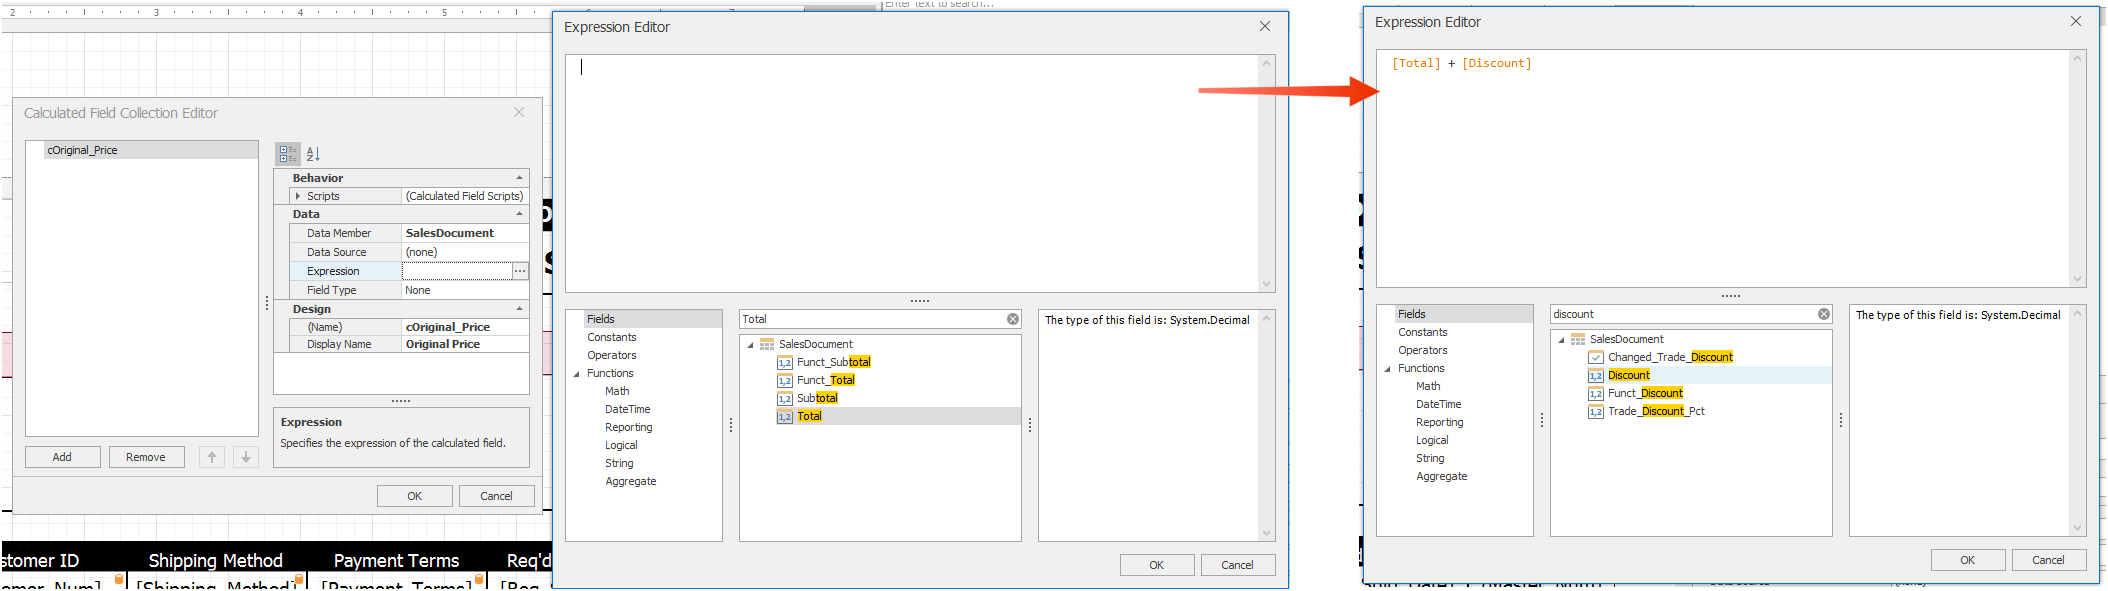
- Click the field next to Expression and click the appearing ellipsis (…) button. The Expression Editor appears, where the calculations for the field are created
- Enter the desired expression. To calculate the Regular Price/Discount price:
- Click Fields in the left column
- Double-click [Totals] in the middle column
- Click the + button
- Select Parameters
- Double-click [Discount]
- Click OK on both open screens to return to the Designer
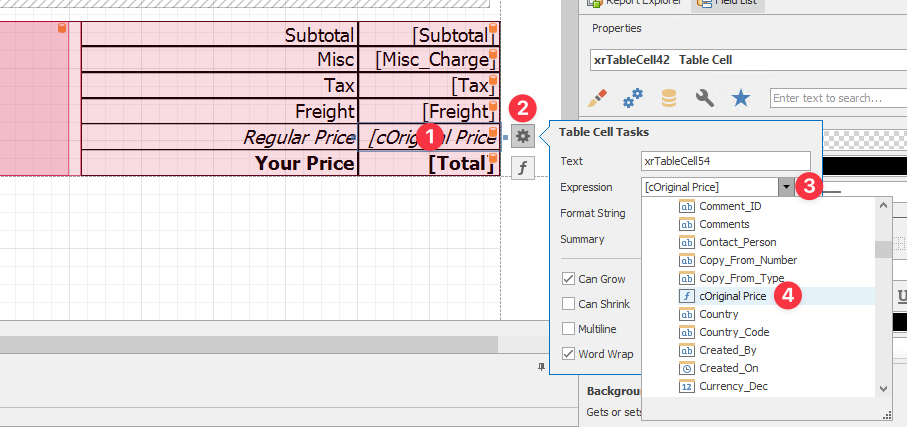
- Click on the table cell you are editing (Regular Price in the example), then click the ⚙ to open the Tasks menu
- Click the down arrow next to Data Binding, click the + to expand Sales Documents and select the renamed calculated field (ex. cOriginal Price)
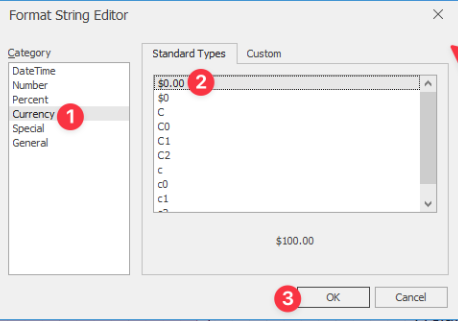
- Click the ellipsis (…) next to Format String.
The FormatString Editor appears
- Select Currency from the left column, and $0.00 from the Standard Types tab
- Click OK
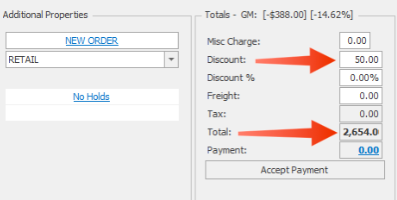
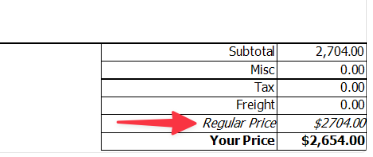
Now, if you click Preview in the Report Designer, the regular price will be calculated, along with the discounted price:
If you are already in the Report Designer, you can preview your changes by clicking Preview.
To preview a report from outside the Report Designer:
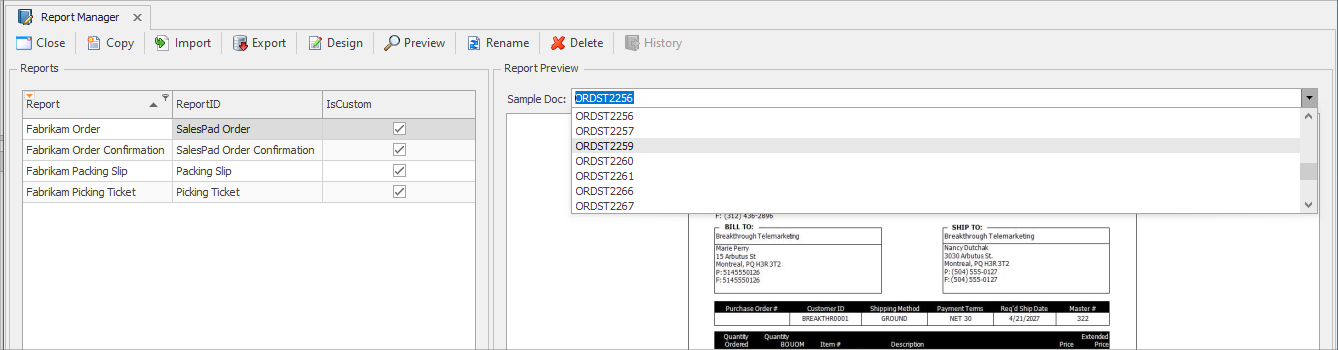
- Go to Modules > Report Manager
- Towards the top of the Report Preview pane you will find the Sample Doc field.
Select a document:
- Click Preview. A new window will appear, displaying the report as it will print for the chosen document
SalesPad Support
Comments