November 7th, 2024
A new version of Cavallo Profit Analytics is now available.
- Terminology in the Margin Variance Analysis feature has been updated to enhance clarity.
- Overall Margin Impact is now referred to as Net Impact.
- Total Losses is now referred to as Gross Losses.
- Total Gains is now referred to as Gross Gains.
- Quantity is now referred to as Volume.
- Several layout updates have been implemented for the Margin Variance Analysis grids. These strategic enhancements to the default layouts aim to better convey the MVA story by presenting focused datasets from the start.
- There has been a significant update in how values are presented in the data grids across Profit Analytics. This includes adjustments to the number of decimal places displayed and the removal of redundant symbols from the cell values. Instead, these symbols will now be indicated in the column captions.
October 31th, 2024
A new version of Cavallo Profit Analytics is now available.
This version of Profit Analytics includes new features and fixes around the application.
-
A new Quantity (#) mode has been added to Items: Top Gainers/Decliners. Users can now investigate quantity variance, period-over-period, to discover meaningful trends and changes in item sales.
-
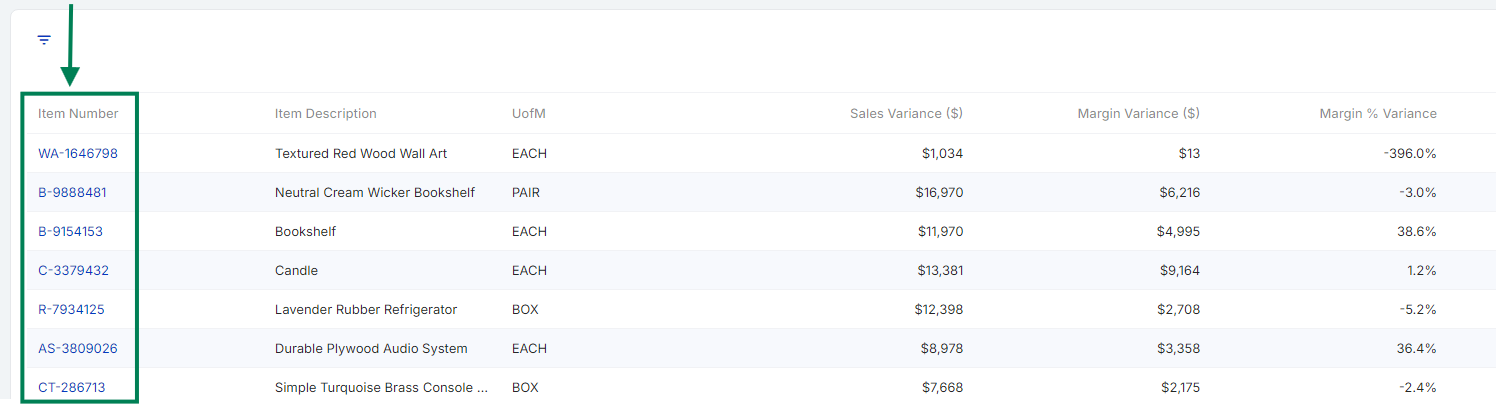
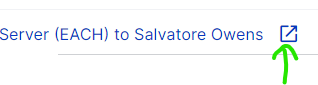
The Item Number is now a hyperlinked column in data grids and, when clicked, will open that item in your source system. This allows the user to quickly navigate to their source system to further investigate item details or related events.
The user must be on a machine with access to your source system for this link to function.
-
The Share View popup now automatically closes after the link is copied, no longer requiring the user to dismiss it manually.
-
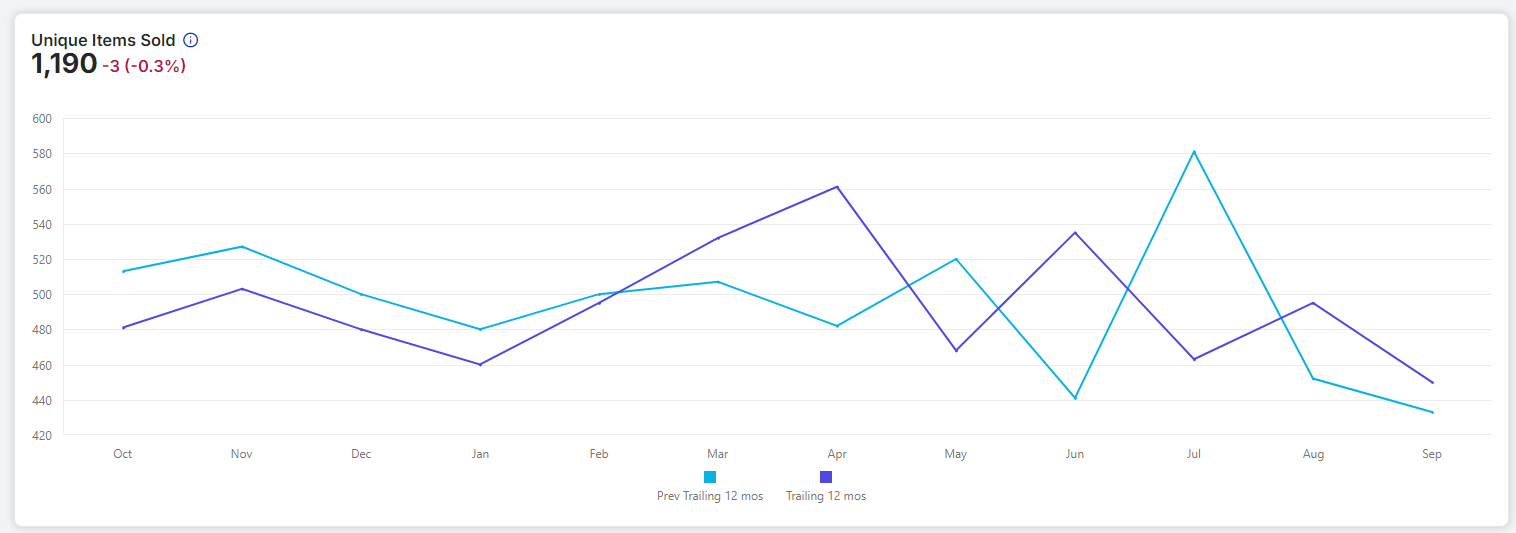
The Unique Items Over Time widget now displays solid lines in order to line up with similar visualizations in the app.
-
Fixed an issue with clearing a selected data point on the COGS Trend chart.
-
Fixed an issue restricting the filtering of date columns in data grids.
-
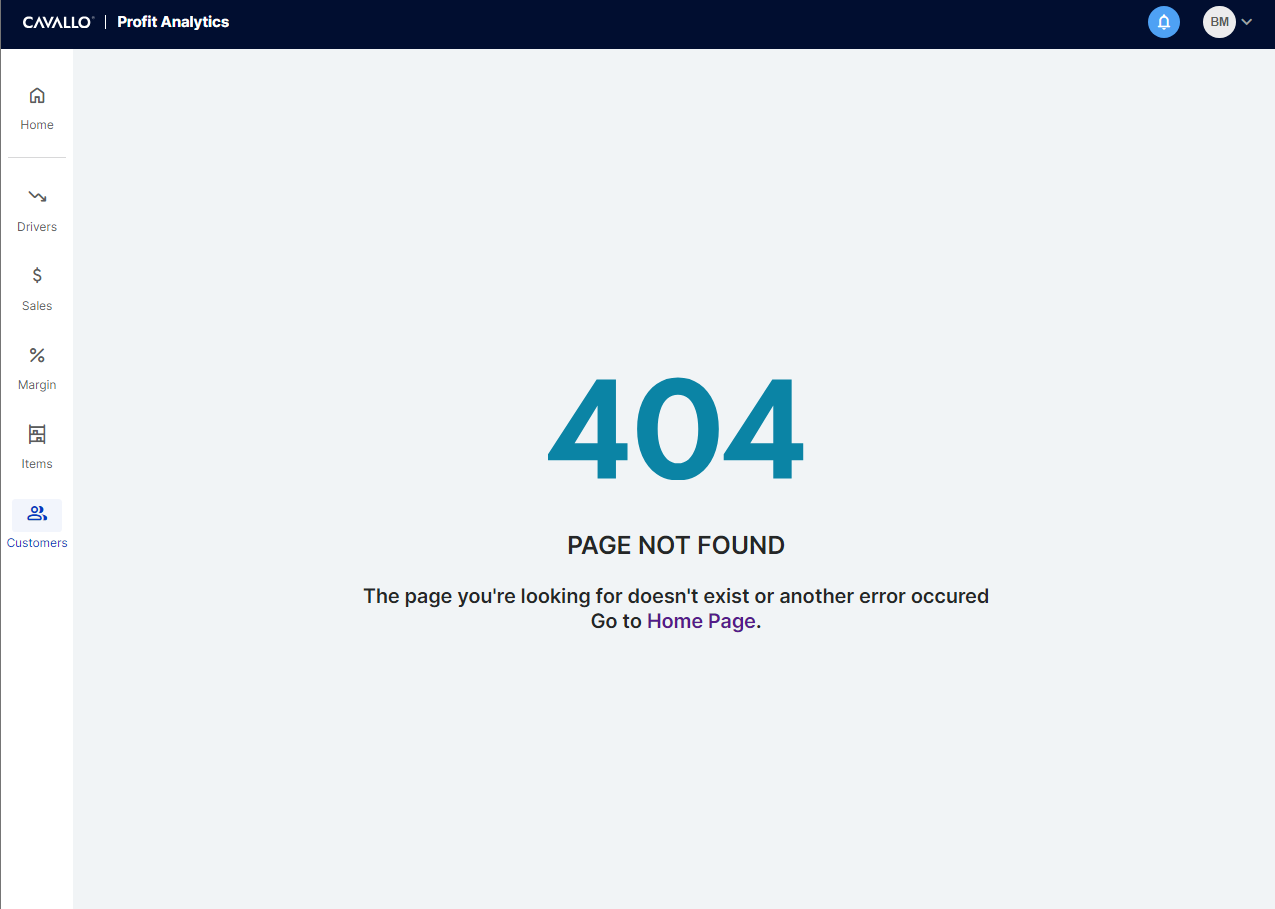
Fixed an issue that resulted in a 404 when the breadcrumbs were clicked when on view related items in the Margin Variance Analysis flow.
-
Improved URL handling so unsupported parameter values no longer cause a 404 error screen, and instead route the user to the underlying page.
-
Removed the Historical At column. After internal system changes, this column no longer served a meaningful purpose.
October 10th, 2024
A new version of Cavallo Profit Analytics is now available.
This version of Profit Analytics includes new features and fixes around the application.
-
The Margin Variance Analysis Top 5 functionality has been updated to support Margin Change Overall! This exciting feature enhancement allows the user to quickly view the Top 5 largest losers and gainers side-by-side, based on Overall Impact ($), giving the user an efficient way to see the larger picture on a per-segment basis.
Updates have also been made related to messaging, formatting, value alignment, and null handling, resulting in a consistent and stable experience.
The ability to click through individual results has also been added to the page, resulting in the user landing on the Margin Variance Analysis details screen with that corresponding group auto-expanded.
-
We are excited to announce our color scheme has been updated throughout the application to align with both the Cavallo branding and visual impairment best practices.
-
The Export to Excel functionality across the application has been improved. Now, when exporting the data from a grid, the exported file will include the same column header text as the grid columns in the application.
Profit Analytics will now also limit the data exported to the columns visible in the grid when the “Export to Excel” button was clicked. This gives the user more flexibility regarding the information being exported. -
Column captions throughout the application have been updated to be more consistent.
-
Margin Variance Analysis has been updated to support the Comparison Period option Same Period Last Year.
-
Fixed an issue where a warehouse filter would apply to the document instead of the sales line item in Margin Variance Analysis.
-
Fixed an issue where the expanded group in Margin Variance Analysis would persist when it should not.
-
Fixed an issue that occasionally caused applied grid filters to be invisible.
-
Padding and margins have been updated throughout the application to be more consistent.
-
Reduced unnecessary re-querying for data in Customer Class filter dropdowns.
-
Fixed an issue causing chart legends to disappear when the user changed their browser’s level of zoom.
-
Fixed an issue causing a subset of results to be factored into the summary figures displayed in the Sales by Customer widget table.
-
Fixed an issue with chart tooltips not displaying the year, making it difficult to determine which line represented which period.
Sept 18th, 2024
A new version of Cavallo Profit Analytics is now available.
This version of Profit Analytics includes new features and fixes around the application.
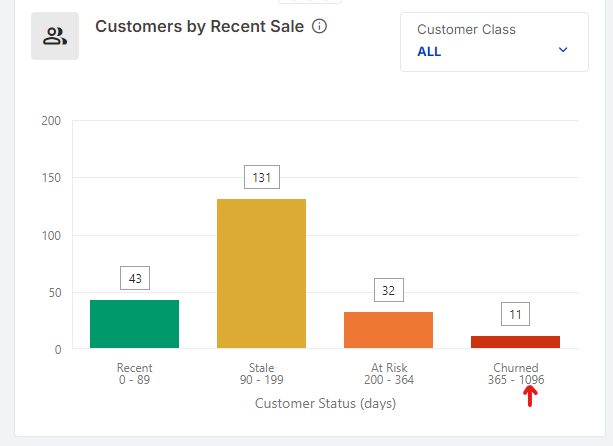
- The Customers by Recent Sale widget now supports viewing results based on the combination of Customer and Ship To Code, not just customer! Users can easily flip between modes with the new toggle available in the header section of the widget.
This feature is especially exciting for companies that use Ship To Code to denote National Accounts, Storefronts, etc.
When Customers by Recent Sale is in Ship To Address mode, the customer data presented will reflect unique combinations of Customer + Ship To Code. If you have a customer called ABC with Ship To Codes corresponding to Location 1, Location 2, Location 3, etc., they will be treated independently in the Customers by Recent Sale results, each presented with the composite customer name "Customer Name: <ship to code>".
Now, a user could quickly identify that ABC Location 1 has bought recently while Location 3 has not, and act accordingly.
Please note that this feature uses the Ship To Code assigned at the Sales Line Item level.
The Ship To-related features will be rolled out to users, so if they are not available to you now, check back again soon.
-
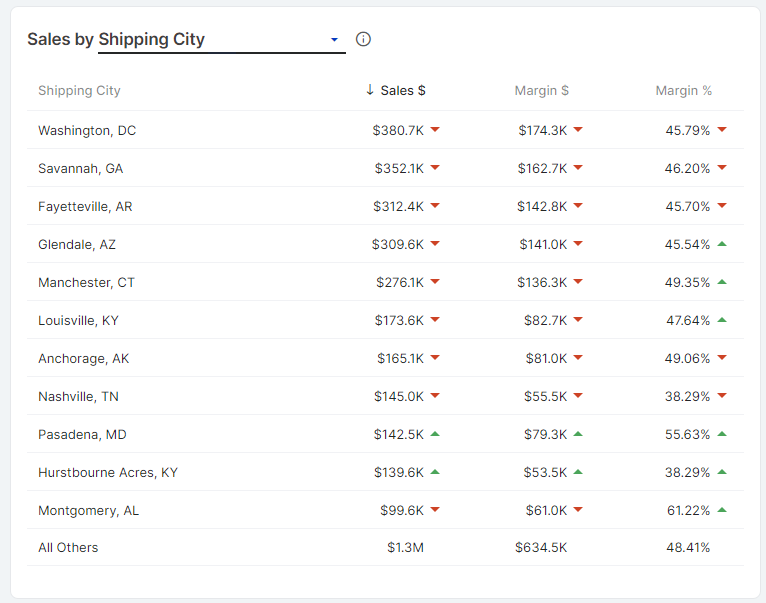
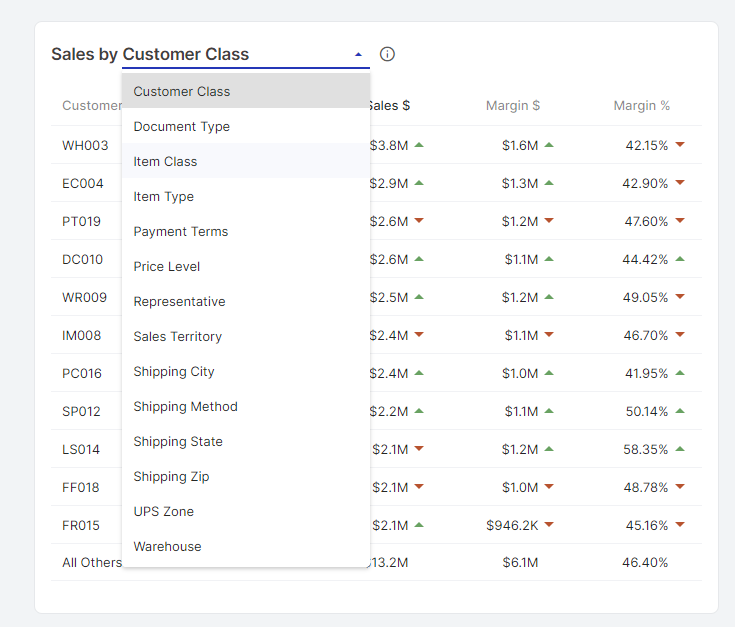
Ship To Code is also now available as a segmentation option in the Sales and Margin by <segment> widgets.
-
Sales, COGS, and Margin by <segment> controls are now searchable!
As the list of options available continues to expand, we want users to have an easy way to find the segment they are looking for.
- The quickfilter bar in Margin Variance Analysis has been improved and now spans the width of the page.
-
Fixed the ability to filter grids using empty text.
-
The “Yesterday” Time Period now ends at the end of the previous date.
-
Fixed an issue that resulted in an incorrect time span being listed on the Margin Variance Analysis widget when the selected Time Period was Year to Date, Quarter to Date, Month to Date, or Week to Date.
-
Fixed an issue that cause the Margin Variance % to overflow the boundaries of the widget.
-
Fixed an issue causing the Unique Items Sold widget to show a 'Data Not Found' state when certain Time Period options were selected.
-
Improved the Margin Variance Analysis clickthrough functionality when clicking a Reason on the detail screen. The user will now land on the Sales by Item screen with line items limited to those that relate to the Reason clicked.
September 5th, 2024
A new version of Cavallo Profit Analytics is now available.
This version of Profit Analytics includes new features and fixes around the application.
- Segment dropdowns now have a search bar, making it easier than ever to find and select the segment you are looking for. The list of segment options will continue to grow as new features are added to Profit Analytics, and this update will help the user quickly get to what matters to them.
-
Ship To Codes have been added to grids throughout the application at both the invoice and sales line levels. Sort, filter, and investigate data in new and interesting ways, especially if your business uses Ship To Code to identify National Accounts, etc.
-
Updated percentages to have consistent formatting (1 decimal place). This precision update will help users read and compare values more effectively.
-
Updated several column captions to be consistent from grid to grid.
-
Fixed an issue where State was showing as undefined when data was segmented by Billing City in `by <segment>` widgets.
-
Fixed an issue where Margin Variance Analysis figures were not aligning.
-
Fixed an issue where toast notifications appeared behind the application header UI elements.
-
Updated the alignment of the values displayed in percent columns.
-
Updated the formatting of displayed counts in Customers Over Time.
-
Updated the calculations behind the percentage columns in Margin Variance Analysis to be consistent across the available quickfilters.
August 20th, 2024
A new version of Cavallo Profit Analytics is now available.
This version of Profit Analytics includes new features, updates, and fixes around the application.
A new Cost of Goods Sold (COGS) Module is now available
An exciting new batch of functionality related to COGS is now being rolled out to users. The COGS Module follows the conventions established by the Margin and Sales Modules, offering a central location for analysis and investigation via COGS-related widgets.
NOTE: This module is being rolled out gradually and will be available in your environment soon, if it's not already.
The COGS Module can be accessed via the COGS navigation pane entry:
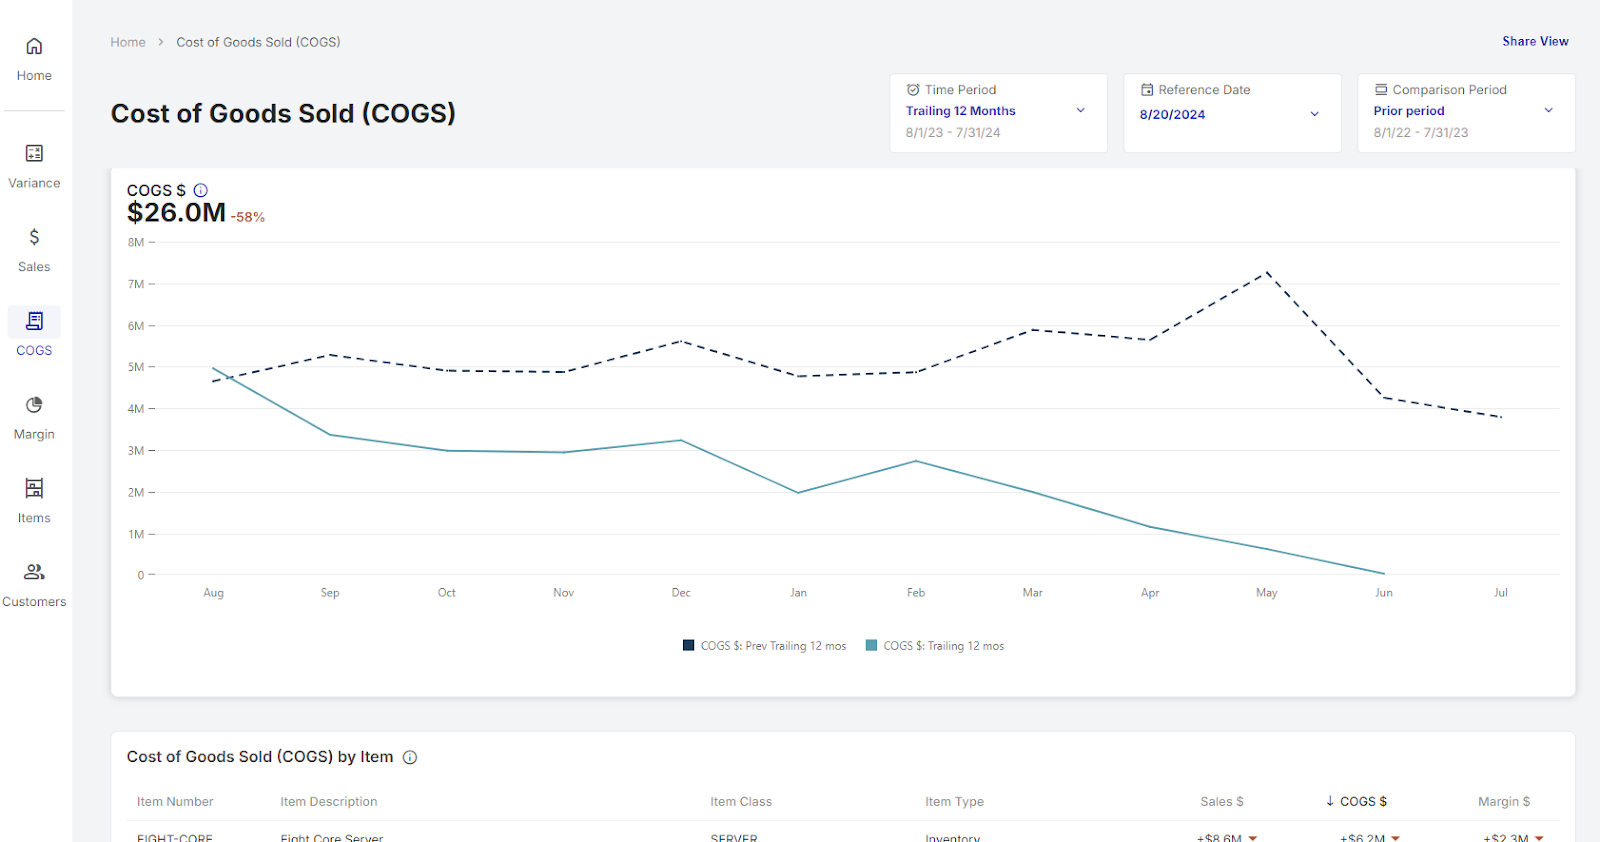
The COGS Module includes a number of widgets, each with its own clickthrough experience. The widgets available are:
-
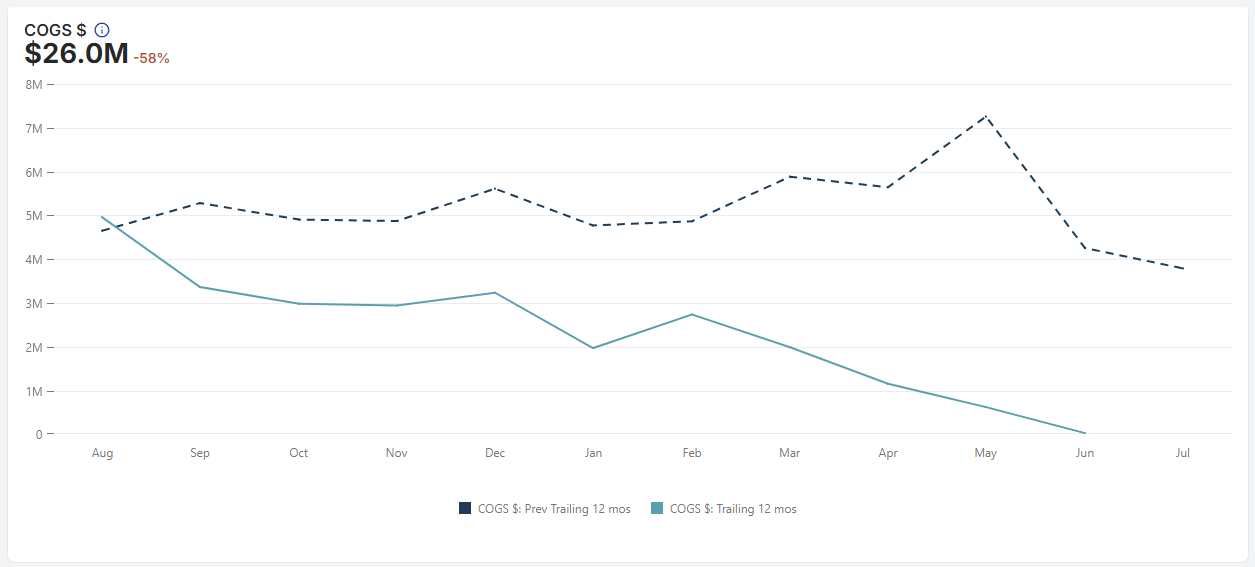
COGS Trend - See your overall cost of goods sold this period versus the comparison period.
-
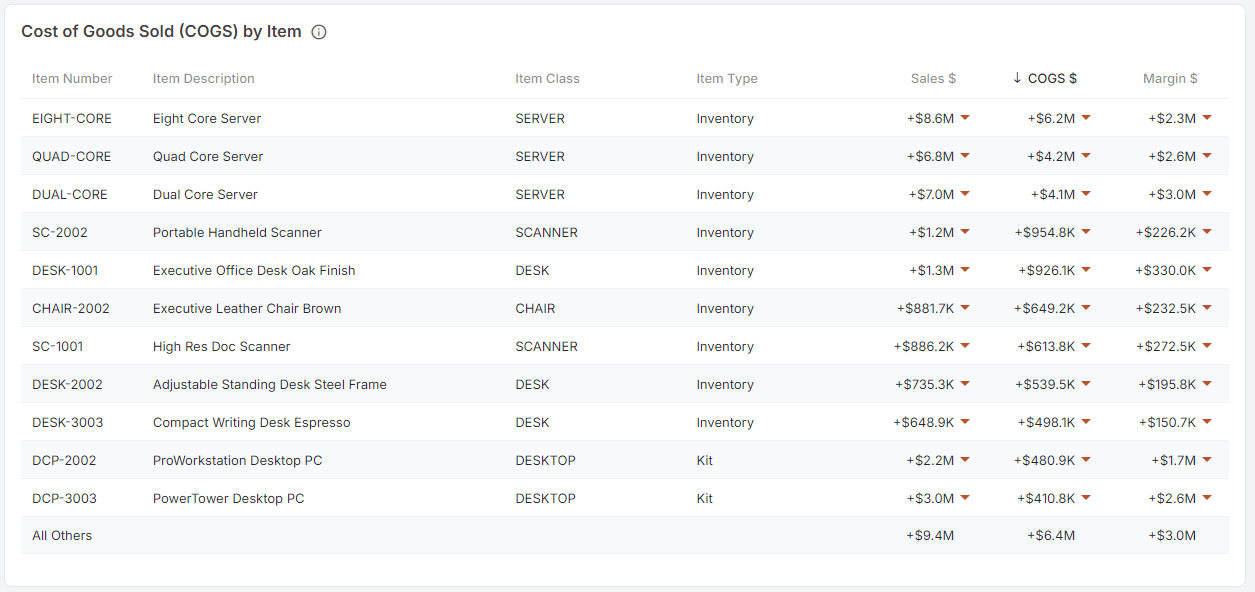
COGS by Item - See your items, ranked by cost of goods sold, for the period.
-
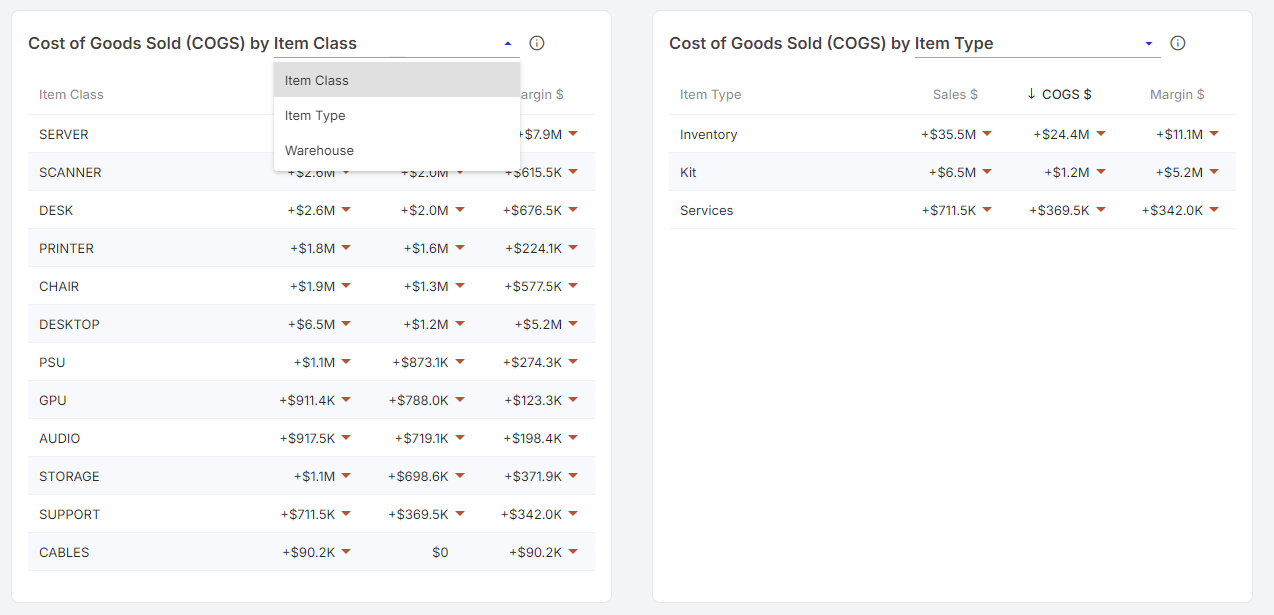
COGS by <segment> - See your cost of goods sold segmented by the options important to your business.
-
Available segment options:
-
Item Class
-
Item Type
-
Warehouse
-
-
Line Summary Charts
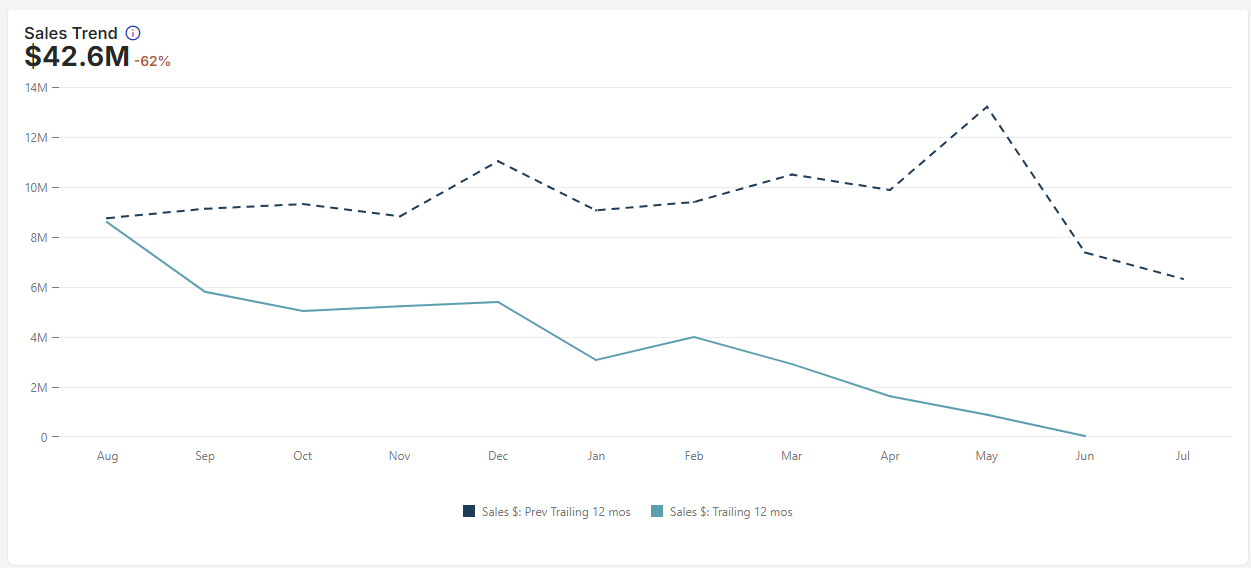
The Margin Trend and Sales Trend widgets now feature line chart visualizations. We believe users will have a better time interpreting and understanding the data at a glance with this new visualization.
This version of Profit Analytics also includes a number of updates and fixes:
-
Updated the following widget titles to better reflect their functionality:
-
Margin is now Margin Trend
-
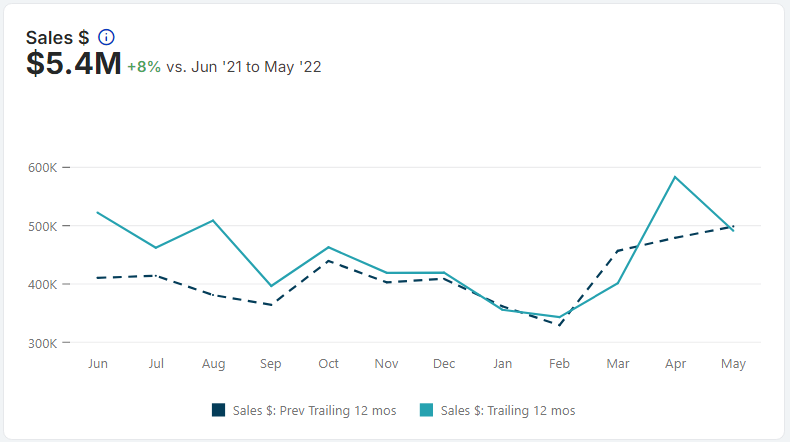
Sales is now Sales Trend
-
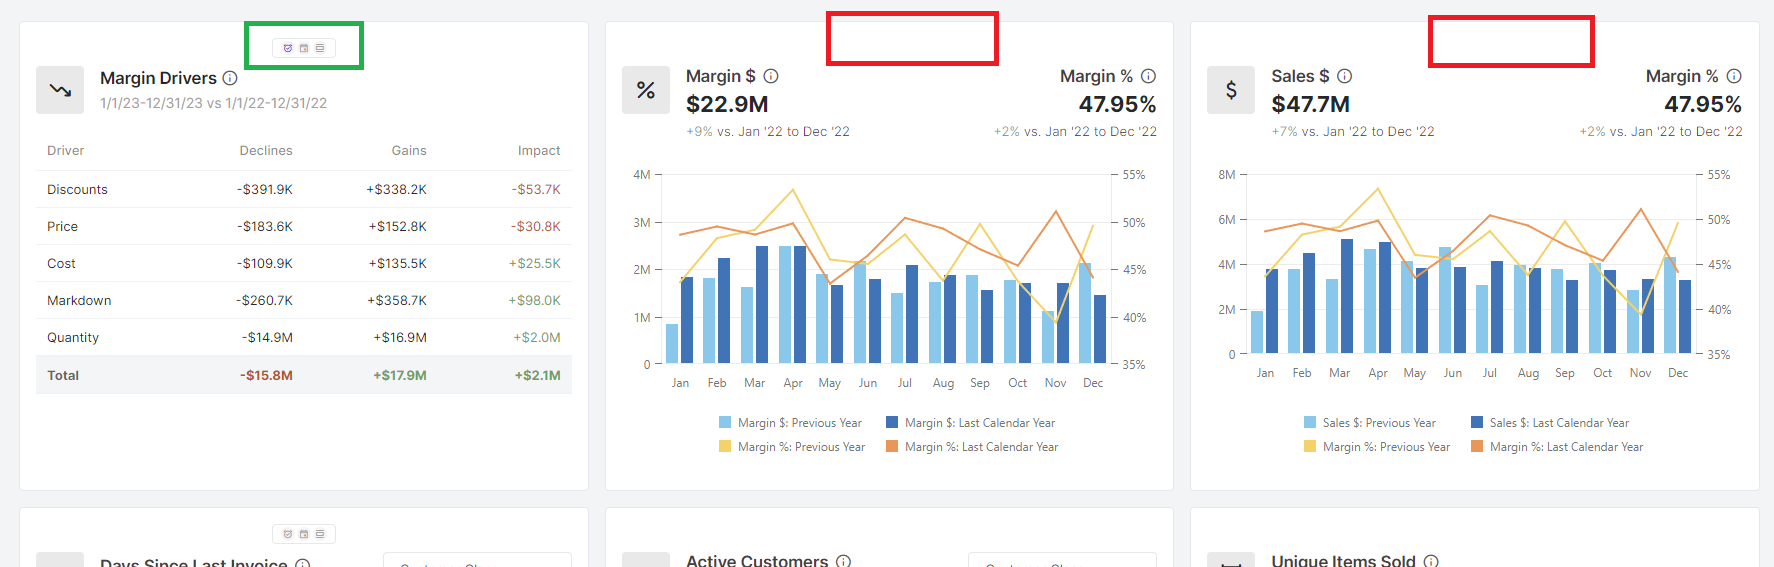
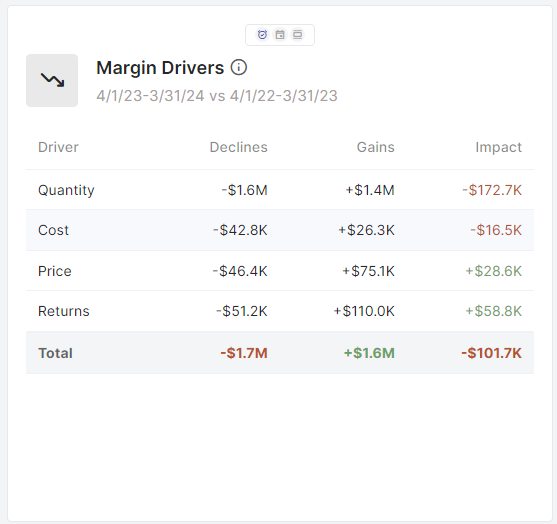
Margin Drivers is now Margin Variance Analysis
-
-
Fixed an issue where a selected row state was wrongly applied.
-
Updated calculations to align values throughout the application. This was accomplished primarily by updating how and when numerical figures were rounded.
-
Updated widgets to remove redundant date range text from their respective header regions.
August 6th-19th, 2024
A new version of Cavallo Profit Analytics is now available with significant new features and updates!
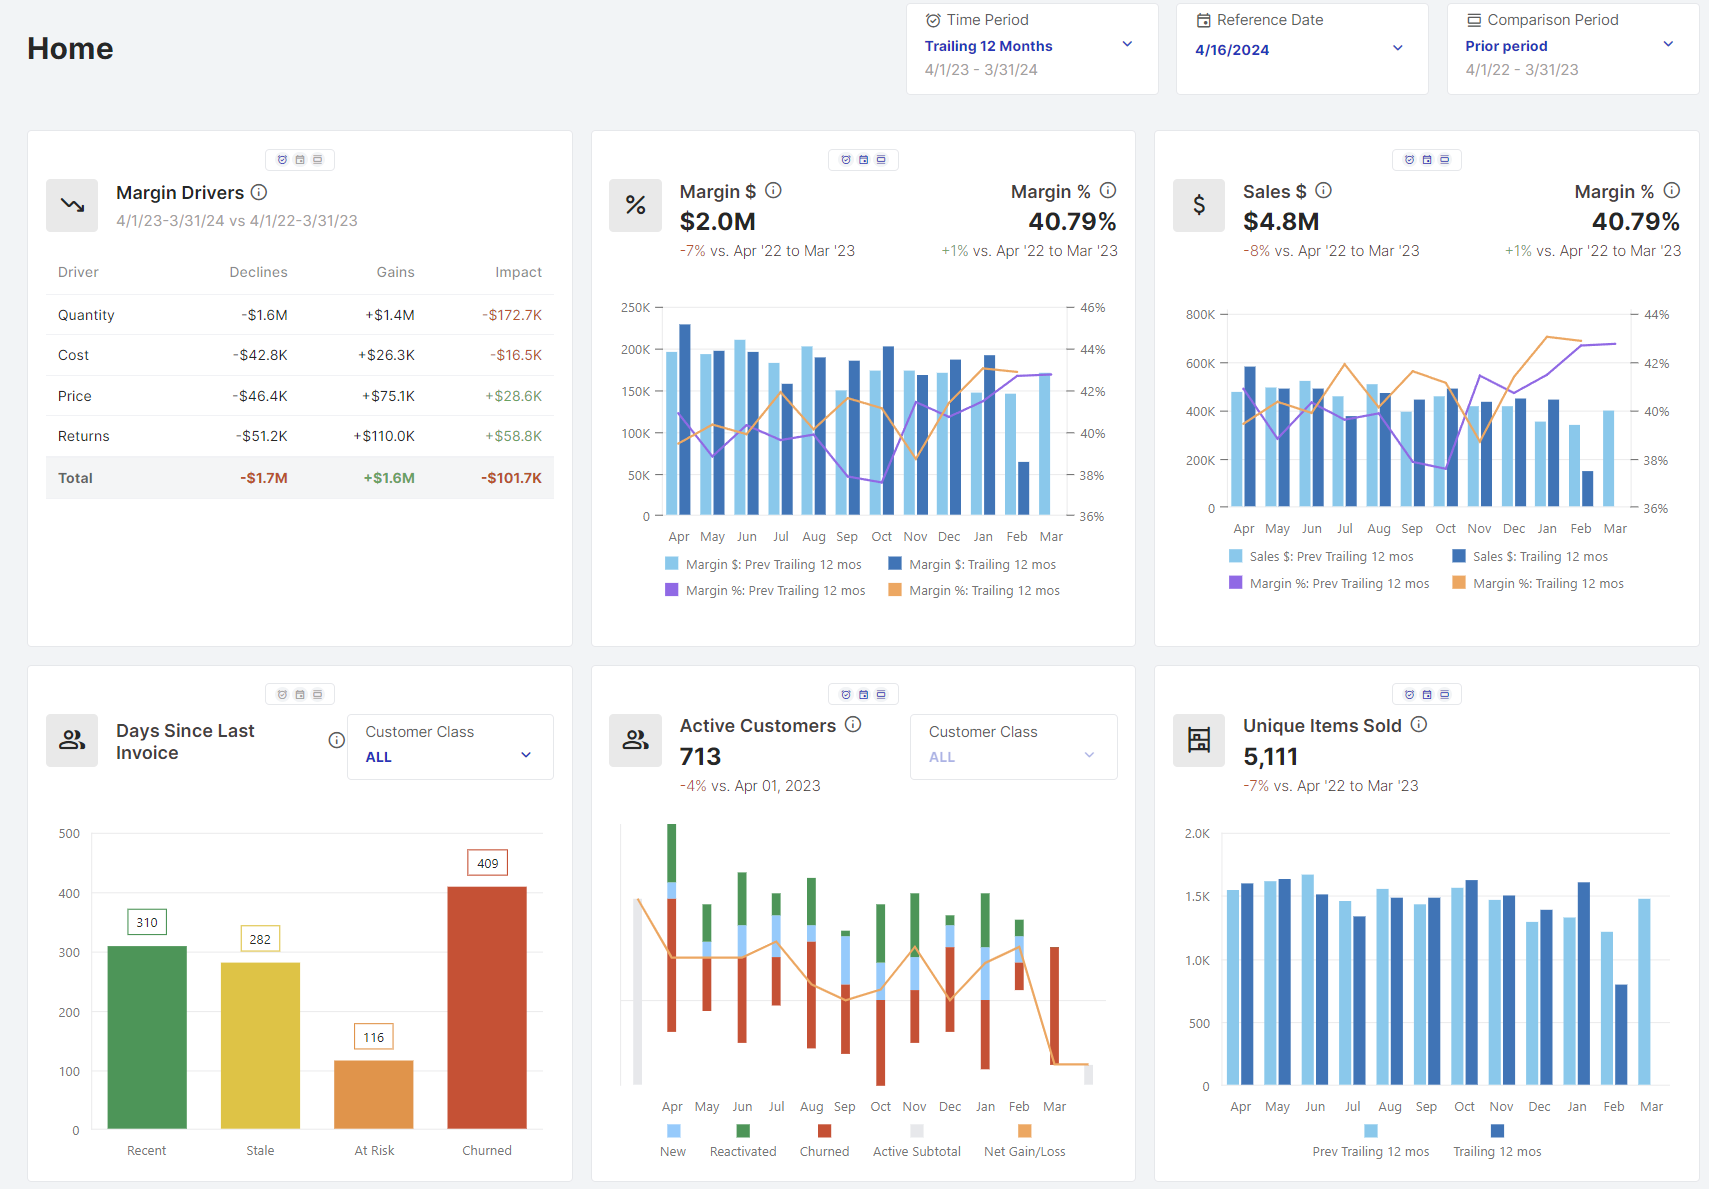
Home Screen & Widget Refreshes!
NOTE: The following features and updates will be rolled out and may not yet be available for every company.
Home Screen - Revamped Experience
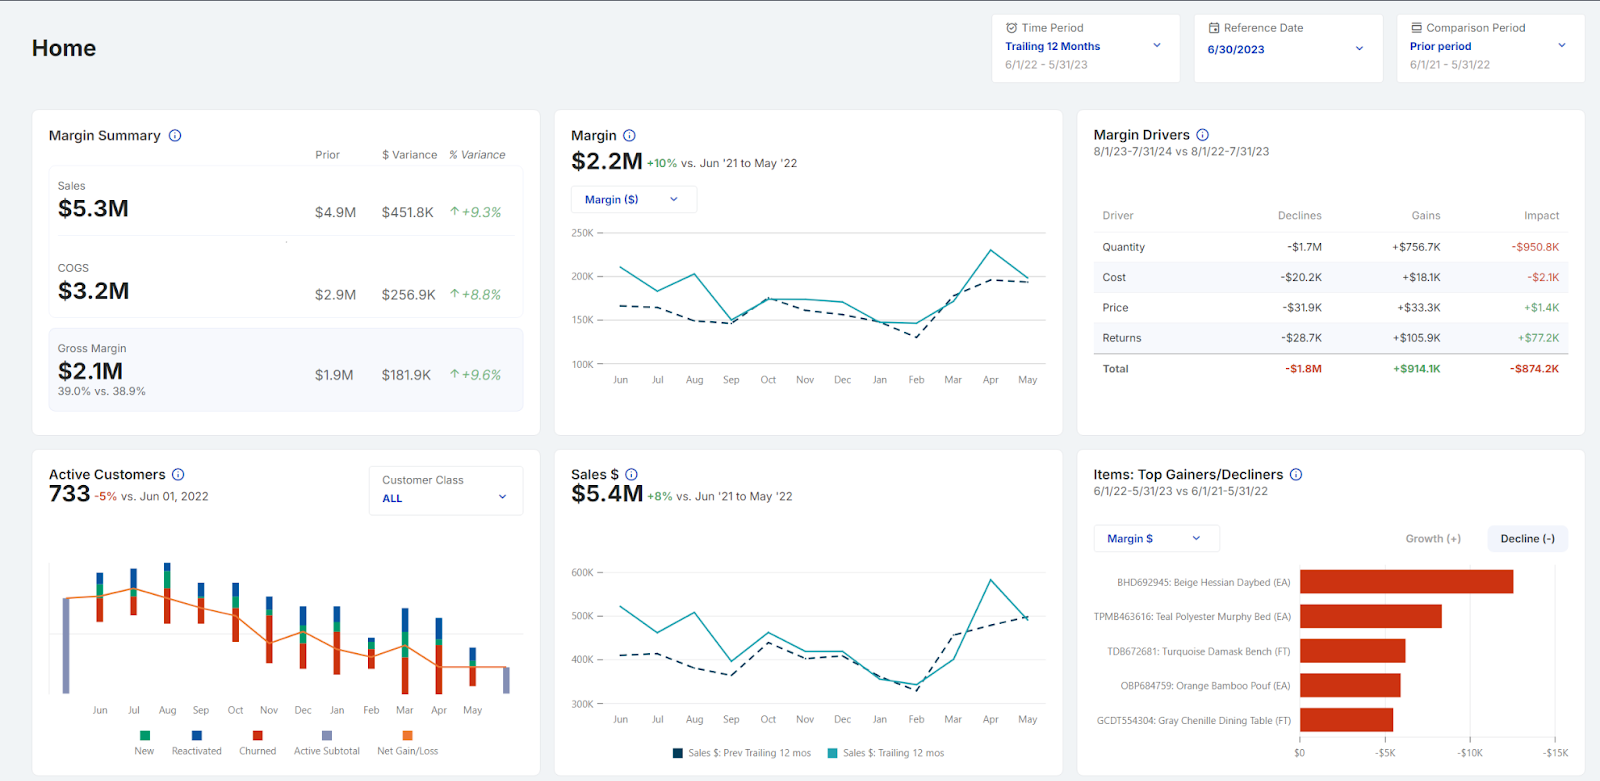
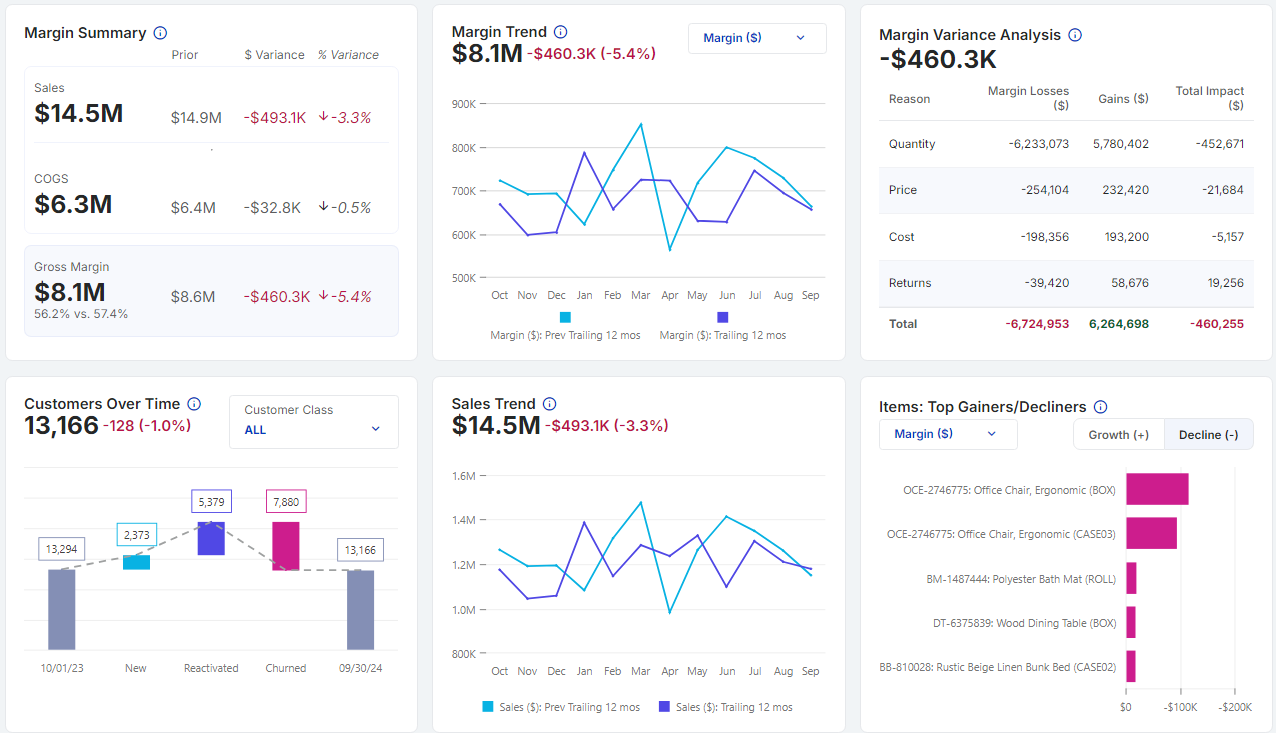
- A new Margin Summary widget has been added to provide a high-level view of profitability (detailed below).
-
Streamlined Widget Presentations:
-
Changes: Improvements to visualizations, both in the form of new charting elements and a consolidation of data presented across all widgets. Redundant and unnecessary text was removed/consolidated.
-
Improvement: Enhanced visual cohesion and usability to help users better understand their overall profitability at a glance.
-
Fewer widgets are now displayed on the Home screen, creating a leaner and more concise experience. The widgets that no longer appear on the Home screen are still available in their respective modules.
-
Benefits of the new experience:
-
A more cohesive and focused experience on the Home screen.
-
Improved clarity and immediate insight into key profitability metrics without being cluttered by secondary information.
New Widget - Margin Summary
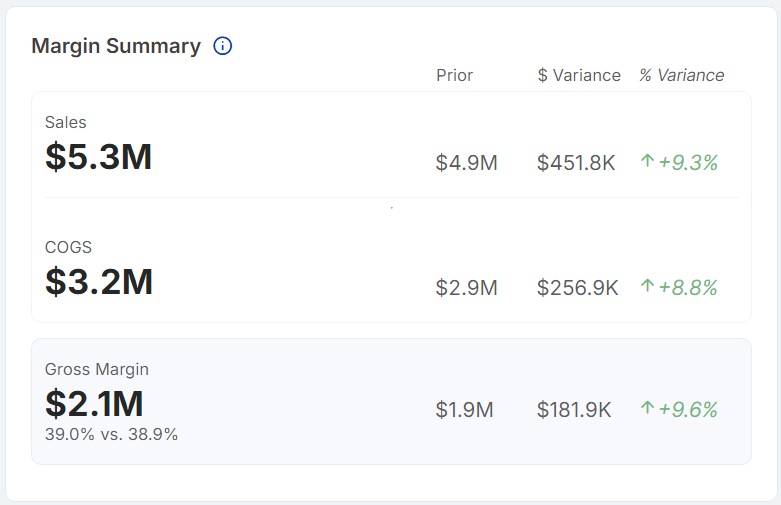
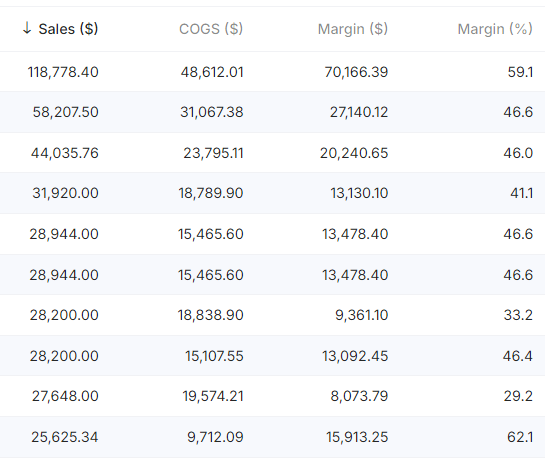
The Margin Summary widget encapsulates the core of your high-level profitability metrics: Sales, Cost of Goods Sold (COGS), and Margin, delivering critical profitability information at a glance.
This widget conveys:
-
Core values for Sales, COGS, and Margin for both the current and prior periods.
-
Variance and Variance Percentage: Displays the difference and percentage change between the current and prior periods, offering a quick insight into profitability trends.
This new Margin Summary widget is featured prominently in the first position on the Home screen.
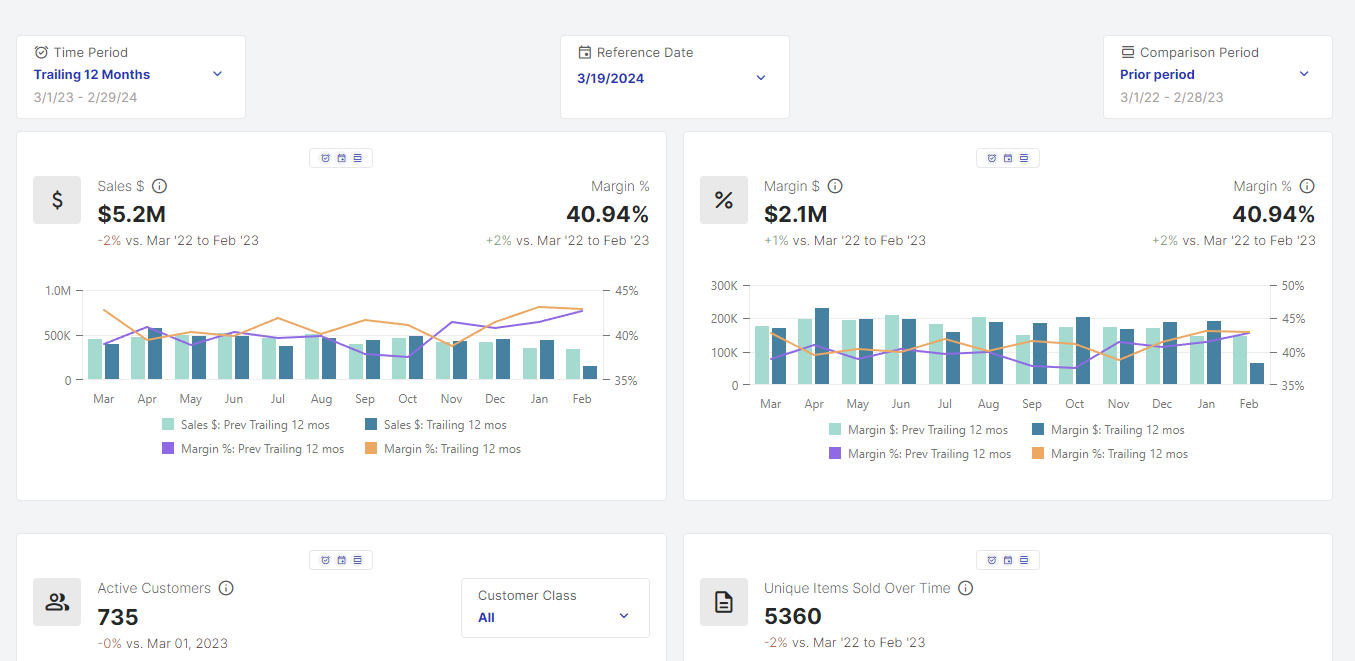
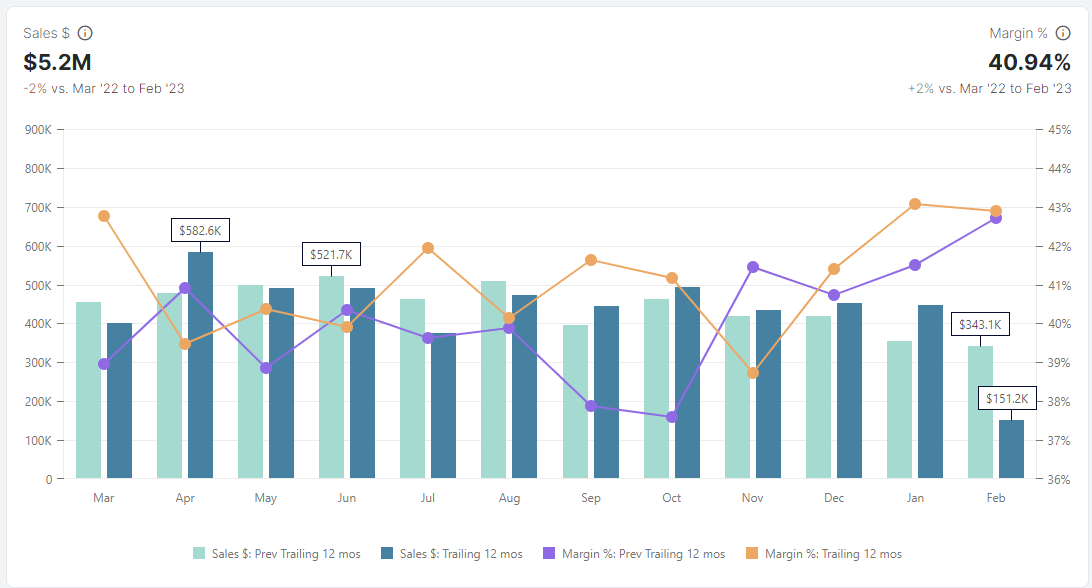
Sales & Margin Widgets - New Line Chart Visualizations
-
The Margin and Sales widgets on the Home screen have been updated from bar charts to line charts for better trend visualization.
-
The solid line represents the current period, and the dashed line represents the comparison period.
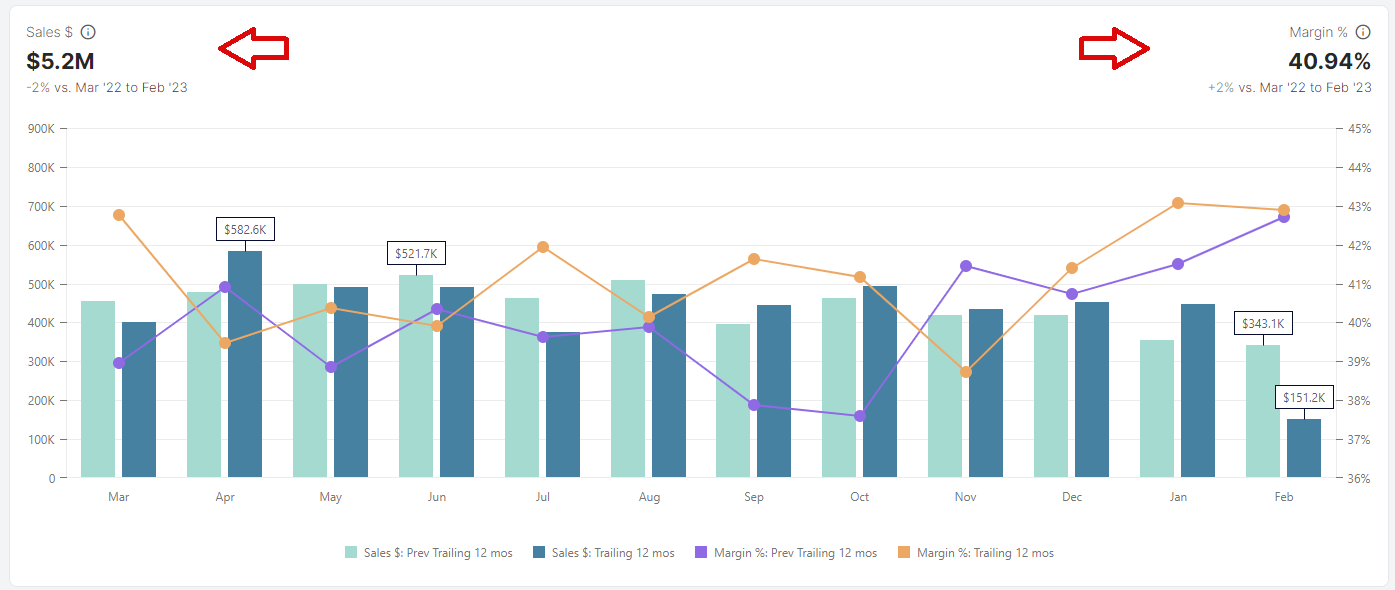
Margin Widget - New Toggle
Users can now toggle between Margin $ or Margin % visualizations via a dropdown on the Margin widget.
Previously, both Margin $ and Margin % were displayed simultaneously with a dual Y-axis, which has been simplified for clearer visualization.
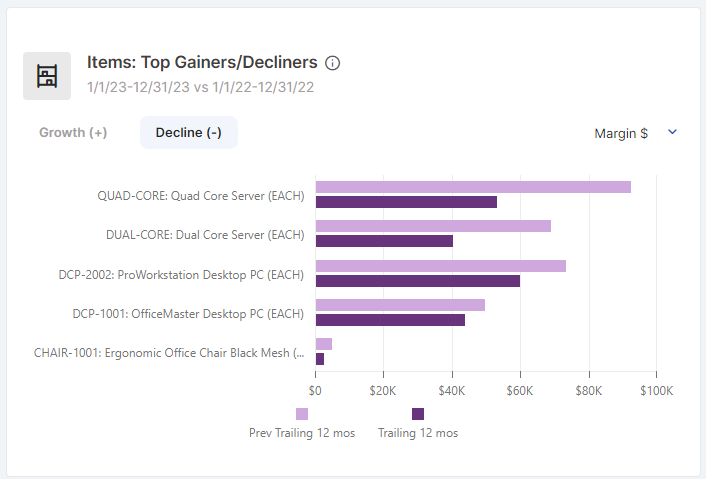
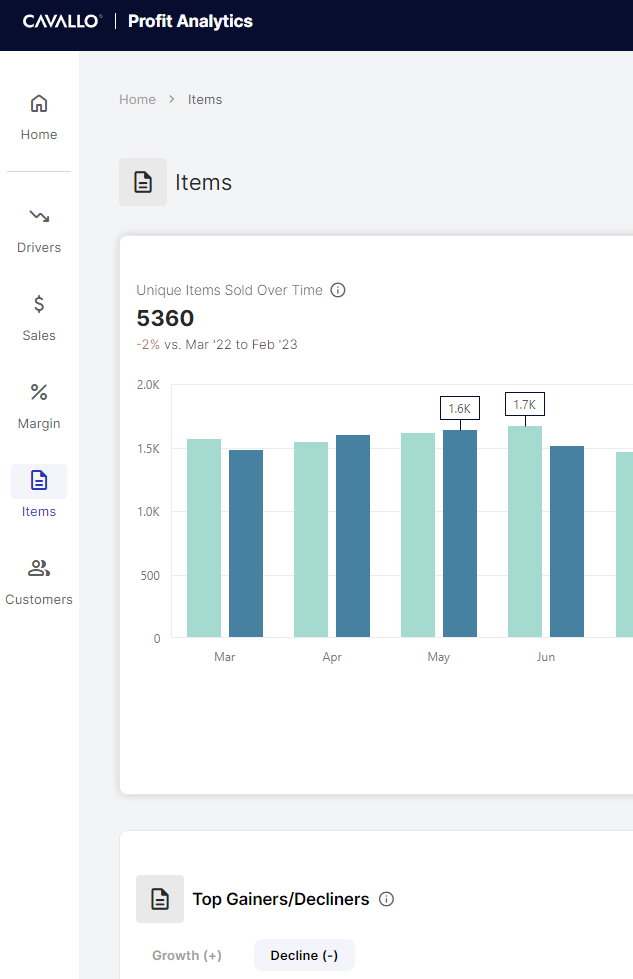
Items & Customers: Top Gainers Decliners - Now focused on variance
Both the Items: Top Gainers/Decliners and Customers: Top Gainers/Decliners widgets now display a single bar representing the variance between the current and comparison periods, rather than showing two bars for each customer or item, respectively, in the list.
-
Improvement: This update better conveys the scale of change between periods by highlighting the variance directly.
-
Hovering over a bar will display tooltip detailing:
-
Current period value
-
Comparison period value
-
Variance value
-
Users can still toggle between the same key performance indicators (KPIs): Sales $, Margin $, and Margin %.
More data than ever is now at your fingertips
Exciting new segmentation options are available throughout the application!
A number of new segmentation options are available in the Margin by <segment> and Sales by <segment> widgets!
New segmentation options:
-
Document-related segments
-
Billing City
-
Billing State
-
Billing Zip
-
Shipping method
-
Shipping City
-
Shipping State
-
Shipping Zip
-
-
Item-related segments
-
Item Class
-
Item Type
-
-
Margin Driver-related segments
-
Customer Sales Rep
-
Additional grid columns are now available
A host of new columns are now available in grids throughout the application. Some of the new columns will be readily available in their respective default layout, while others will be available in the Column Chooser for users to pull out onto the grid as desired.
-
Document-related grid columns
-
Grids where the new columns can be found:
-
Sales Trend grid
-
Margin Trend grid
-
Sales by <segment> grids
-
Margin by <segment> grids
-
-
New Columns:
-
Billing and Shipping address fields
-
City
-
State
-
Zip
-
-
Customer PO
-
Shipping Method
-
Warehouse
-
-
-
Customer-related grid columns
-
Grids where the new columns can be found:
-
Customers: Top Gainers/Decliners grid
-
Sales by Customer grid
-
Margin by Customer grid
-
Customers Over Time grid
-
-
New Columns:
-
Billing City
-
Billing State
-
Billing Zip
-
Billing Phone
-
Billing Email
-
Lifetime Return #
-
Lifetime Posted Invoice #
-
Lifetime Sales $
-
Cust. Sales Rep
-
Shipping City
-
Shipping State
-
Shipping Zip
-
Shipping Email
-
The following columns are only available on the Customers: Top Gainers/Decliners and Customers Over Time grids:
-
First Invoice Date
-
Last Invoice Date
-
-
-
-
Item-related grid columns
-
Grids where the new columns can be found:
-
Sales by Item grid
-
Margin by Item grid
-
Items top Gainers/Decliners grid
-
Unique items Sold Over Time grid
-
-
New Columns:
-
Item Class
-
Item Code
-
Item Type
-
-
Readily Available Features & Updates
NOTE: The following release notes cover updates that are readily available to all companies.
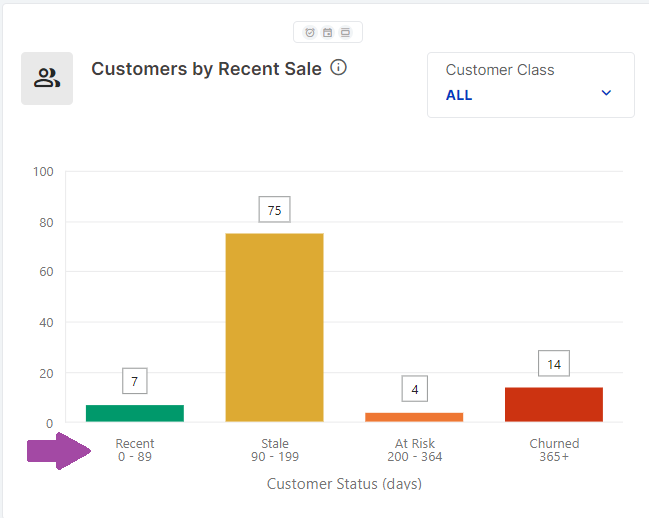
- A new Churn Age Limit setting has been added to the system, allowing you to set an age limit on customers included in and represented by the Churn bar in the Customers by Recent Sale widget. For example, if you want to focus only on the customers that have churned in the last five years because that is the data you deem meaningful to your company, this limit can now be set, and customers that churned further back than that limit will not be reflected.
If you wish to set this limit, please contact Cavallo. We would be happy to configure this setting for your company.
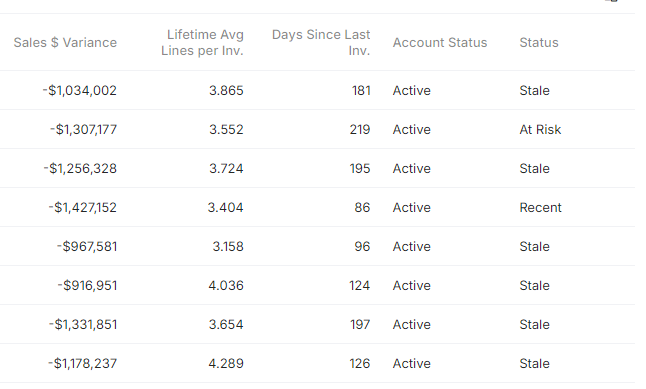
- A new column, Account Status, has been added to several customer-related grids. This column represents whether the customer's record is explicitly set to Active or Inactive in the source system. Depending on the data you're investigating, filtering results based on whether the customer's account is active may be beneficial in focusing your investigations and reporting.
Grids where this column can be found:-
Customers: Top Gainers/Decliners
-
Customers by Recent Sale
-
-
Spacing and padding have been updated across the app to improve visual alignment.
-
The behavior when clicking on the Customers or Items Gainers/Decliners widgets has been updated. Now, when clicking through to the details page, the grid's default sorting will adapt based on the KPI option you currently have selected, and the default sort direction will depend on whether the Growth (descending sort) or Declines (ascending sort) toggle is selected.
-
Sales $ => Sales $ Difference column
-
Margin $ or Margin % => Margin $ Difference column
-
-
We also updated the URI Linking behavior in grids.
-
If you are a SalesPad company, the URI links to open SalesPad will only show if you are on a Windows computer.
-
If you are a GP-only company, they will never be visible.
-
If you are a Business Central company, links will be available on all browsers.
-
-
We fixed a bug where empty text was appearing as an unnecessary option in Customer Class filter dropdowns.
July 25th, 2024
A new version of Cavallo Profit Analytics is now available.
This version of Profit Analytics includes a number of updates around the application, including the following:
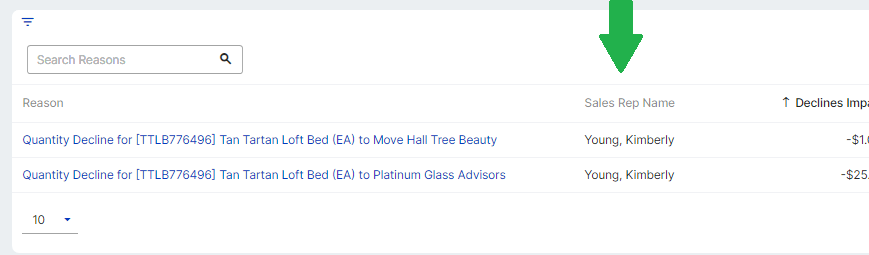
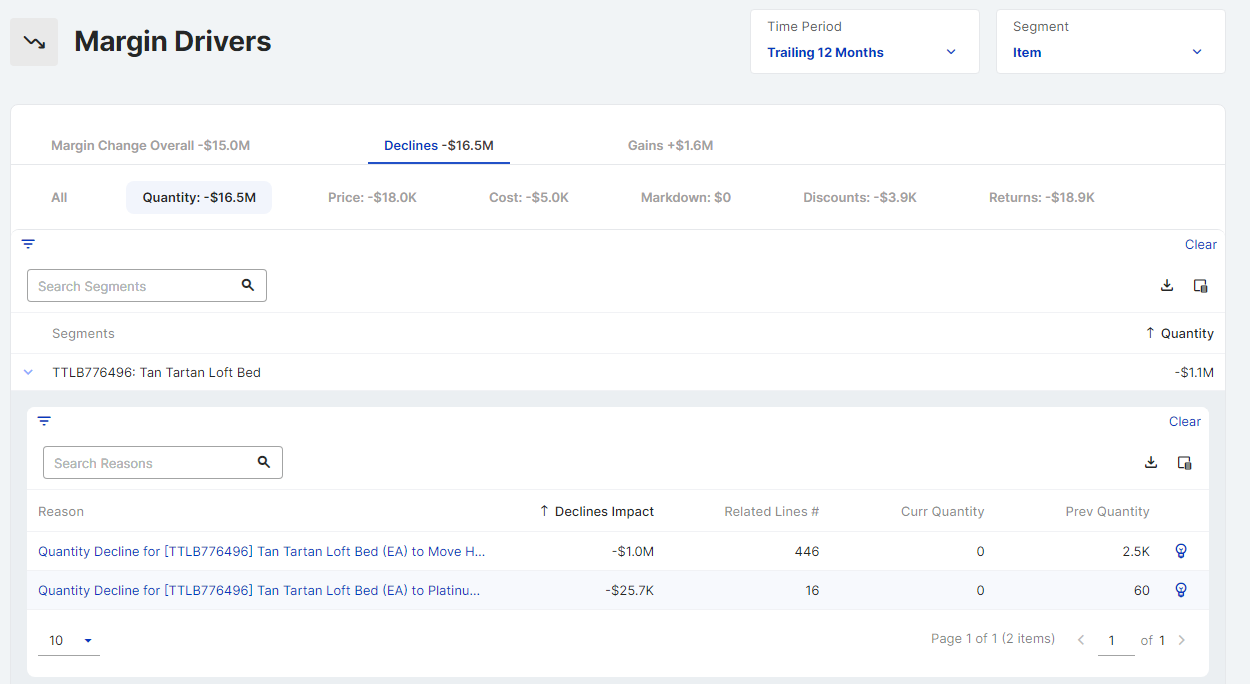
- The sales rep-related functionality in Margin Drivers has been modified. Instead of being included in the segregation of results and included as part of the Reason text itself, the sales rep is now available as a secondary column in the grid. This improves the Margin Drivers functionality by reducing not only the amount of text displayed but also the granularity of the Reasons themselves, leading to easier-to-understand higher-level insights.
This also alleviates an issue where switching the sales representative on a customer would cause two Reasons to display in the results, one a strongly negative Reason related to the previous sales rep declining in sales to a customer (period-over-period), and another at the opposite end of the list for a different sales rep gaining in sales for the customer.
Please note that the Sales Rep column now available in the grid is the associated customer's assigned sales rep, not a document's assigned sales rep. Sales rep is also still available as a segment in the Segment dropdown, allowing you to continue to group the results by Sales Rep.
- The grids in Profit Analytics have been updated to display rows with an alternating row color. This feature will help with readability across the application.
- To improve readability and the ability to better interpret the data at a glance, updates have been made to remove unnecessary columns while using specific quickfilters in Margin Drivers. For instance, if the Declines quickfilter is selected, the Gains Impact and % of Total Gains columns will no longer visible/available in the grid.
This change will help prevent users from getting into a confusing state regarding the data being presented.
- The support for Integrated Security (Windows Auth) to SQL Server in the GP Exporter application has been deprecated. This feature was removed as it did not align with the data platform improvements that have been made to the underlying system.
- Updates were made to loading skeletons to better align them with the visualizations. This improves the application experience as those mis-alignments tend to catch the users eye, causing distraction.
- Fixed an issue that resulted in the user arriving at a non-functional screen if they attempt to access a non-existent screen in the application.
July 9th, 2024
A new version of Cavallo Profit Analytics is now available.
This version of Profit Analytics includes a number of updates around the application, including the following:
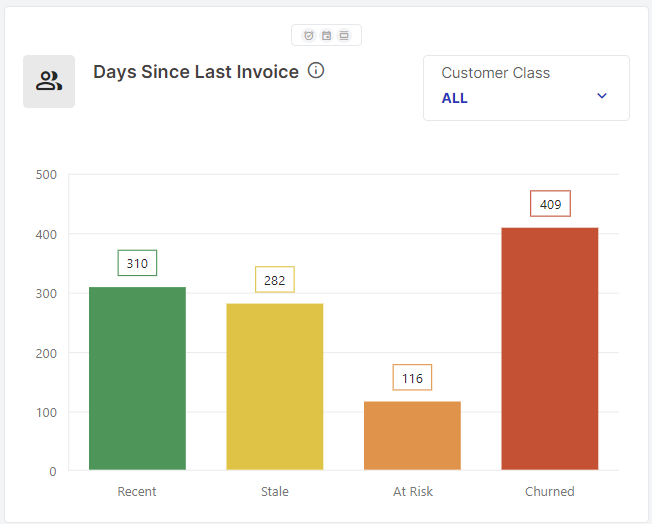
- The Days Since Last Invoice widget has been renamed to Customers by Recent Sale. In addition to the rename, the chart labeling has been improved to include the day range of the customers that fall into that status:
- The grids in Margin Drivers have been improved to give more space to the Segments and Reason columns. Less data will be truncated, especially for users with long item names and descriptions.
June 26th, 2024
A new version of Cavallo Profit Analytics is now available.
This version of Profit Analytics includes a number of fixes and updates around the application, including the following:
- The city notation has been improved when segmenting sales or Margins by shipping city or billing city. The text displayed now includes the state information as well. This helps users more specifically identify which city is being referenced. This improvement was also made on the clickthrough details screen.
- The Item and Customer Top Gainers/Decliners widgets have been updated with horizontal layouts. The previous version heavily truncated the x-axis labels, which reduced the effectiveness of the data being shown. By flipping the axis, more of the customer and item information can be displayed at once.
- The Reason links in Margin Drivers now include an icon indicating that they will take the user to an external page when clicked.
-
Fixed a sorting issue in Margin Drivers. Previously, results with no value for financial impact columns would be sorted to the top of the list if the user chose that column to sort the grid. Now, those values are treated as $0 and are sorted accordingly.
-
Several widgets no longer re-initialize unnecessarily when filter options are changed.
June 14th, 2024
A new version of Cavallo Profit Analytics is now available.
Exporter 2.1
This version includes a new major release of the Exporter application. The new version will be installed automatically for those with auto-update enabled in their current Exporter. Those with auto-update disabled will be sent a new build of the Exporter so it may be manually installed.
The new version will facilitate the support for exciting new fields, segments, and reports in Profit Analytics. Coming major features like User Defined Field support will also rely on this new functionality, leading to more insights into profitability.
Profit Analytics Web App
This version of Profit Analytics includes a number of fixes and updates around the application, including the following:
-
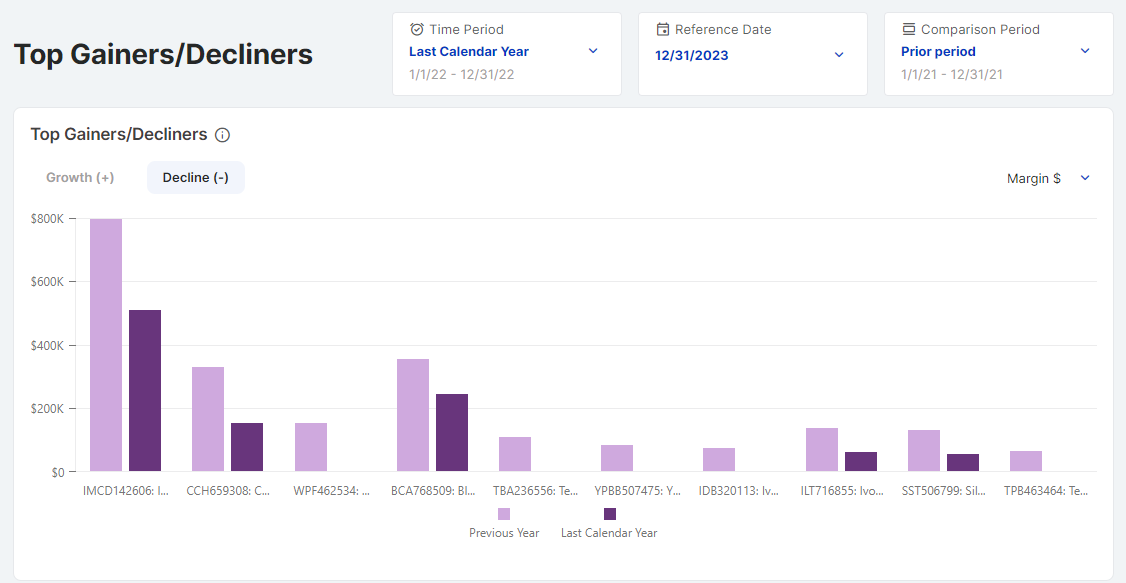
The 'Items Top Gainers/Decliners' and 'Customers Top Gainers/Decliners' widgets now support all Time Period, Reference Date, and Comparison Period screen filters on both the Home screen and their respective detail screens.
-
Added dynamic columns to Margin Drivers, consolidating and simplifying the data displayed, improving readability to clarity. Key columns are hidden/revealed with respect to the specific Impact Type and Driver Type quickfilters selected, ensuring meaningful data related to the user's selections are the focus of the grid.
-
Updated Days Since Last Invoice to no longer reload when a bar selection is made.
-
Fixed an issue where filters involving Document Type were not being applied correctly, resulting in only a partial result set being returned.
-
Fixed an issue resulting in some clicks not navigating the user to the underlying data in the 'Top Customers Gainers/Decliners' and' Top Items Gainers/Decliners' widgets.
-
Updated Margin Drivers to display 0's instead of '--'. This makes the data easier to read, and also improves the sorting process, as 0's will be sorted to the middle of the results.
-
Updated Margin Driver calculations to improve 'weighted' value accuracy.
Please Note: If you do not see the updates detailed above, press CTRL+Reload Button (Windows) or SHIFT+Reload Button (Mac) to hard reload the website.
May 28th, 2024
A new version of Cavallo Profit Analytics is now available.
This version of Profit Analytics includes a number of fixes and updates around the application, including the following:
-
Added new auto-sorting features to the grid in Margin Drivers. When the data is segmented, clicking one of the Driver Type quickfilters will auto-sort the grid by the corresponding column, either descending or ascending based on which Impact quickfilter is active. This allows for quicker analysis, especially when walking through the Driver Types.
-
Improved ease of use by alphabetizing and removing redundant language from the Sales/Margin by Segment widget dropdown selectors.
-
Improved ease of use by removing the Filter Indicator bars from widgets supporting all screen-level filters. Now, users can easily identify which widgets do not support all of the filters in some capacity.
-
Fixed the formatting of numbers in several grid columns in the application. The numbers in these columns were not properly formatted with commas where appropriate.
-
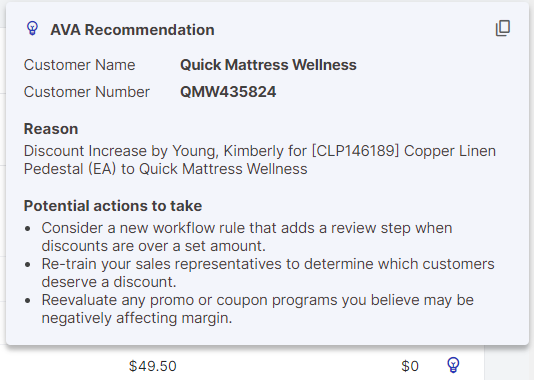
Added new AVA recommendation tooltips to Margin Drivers, related to the Price Driver Type.
-
Fixed an issue causing Notifications to fail to load.
May 15, 2024
A new version of Cavallo Profit Analytics is now available.
This version of Profit Analytics includes a number of fixes and updates around the application, including the following:
- Added hyperlink support to Item and Document columns (Document Id and Item Number) throughout the application, allowing the user to click through and view the associated item or document in Business Central [BC ONLY]
- Added new columns to Margin Drivers to expose the underlying Gains and Declines components of Impact for a given reason.
- Improved application performance by restructuring underlying queries.
- Improved application performance by removing redundant queries.
- Fixed an issue in Margin Drivers where special characters appearing in underlying data would cause an error state to be displayed.
- Fixed an issue where null values would cause misaligned labels and coloration in the Margin Drivers widget on the Home screen.
- Fixed an issue that prevented a selected bar in the Customers: Days Since Last Invoice chart from appearing highlighted.
- Fixed an issue where selecting the "(BLANK)" filter option in a dropdown would cause the query to return no results.
- Updated Sales Rep name formatting to be consistent.
- Updated number formatting to be more consistent across the application.
- The following new features require a new version of the Exporter. The new version of the Exporter is expected to be available in the coming weeks. [GP/SalesPad ONLY]
- Added new shipping and billing-related columns to document and customer grids.
- Added new shipping and billing-related segmentation options to the Sales/Margin by <segment> widgets. This will allow the user to view their sales and margin figures by billing or shipping City, State, or Zip Code.
May 2, 2024
A new version of Profit Analytics is now live and available to users.
Business Central Customer Linking
In the latest release, we're excited to announce customer linking functionality for Business Central companies using Profit Analytics. Customer columns in grids across the application are now hyperlinked, allowing the user to clickthrough and land on the Customer Card for that customer in Business Central. This functionality will be extended to support other clickthrough opportunities in upcoming releases.
This feature allows the user to more easily investigate and take action.
If you have a customer marked At Risk in the Days Since Last Invoice widget, for example, you could now click on the customer to view them in your Business Central to further investigate or take action.
New Columns Available [GP/SalesPad]
To enhance the application's functionality and provide users with more detailed insights, we are expanding the ERP fields supported by the application. This expansion will allow users to access additional data points directly within the application's various grids.
All of the new customer columns will be added to the Column Chooser.
-
New Item Column: Item Type
-
Grids Supporting the new columns:
-
Margin by Item widget on the Margin screen
-
Sales by Item widget on the Sales screen
-
Grid on the Sales by Item detail screen
-
Grid on the Margin by Item detail screen
-
Grid on the Items: Top Gainers/Decliners detail screen
-
Grid on the Unique Items Sold Over Timedetail screen
-
- Column Added
- Item Type
-
-
New Customer-related Columns
IMPORTANT NOTE: These new fields require an updated Exporter application to be installed. The new Exporter version will be available soon and will be rolled out to customers. These fields will NOT be accessible until you have this new Exporter version.
- Grids supporting the new columns:
-
Sales/Margin by Customer detail screen grids
-
Active Customers detail screen grid
-
Customers: Top Gainers/Decliners detail screen grid
-
- Columns Added
-
First Posted Invoice
-
Last Posted Invoice
-
Billing City
-
Billing State
-
Billing Zip
-
Billing Email
-
Billing Phone
-
Lifetime Return #
-
Lifetime Posted Invoice #
-
Cust. Sales Rep
-
Cust. Sales Rep Code
-
Cust. Sales Person
-
Cust. Sales Person Code
-
Shipping City
-
Shipping State
-
Shipping Zip
-
Shipping Email
-
Shipping Phone
-
-
-
- Grids supporting the new columns:
New Segmentation Options Support
See your data in a new light through newly supported segmentation options!
GP/SalesPad/BC
Item Type is now available as a segment in both the Margin Module and Sales Module, allowing you to easily investigate financial figures per defined item type.
BC Only
Item Category Code is now available as a segment for Business Central companies.
General Fixes and Updates
This version of Profit Analytics also includes a number of fixes and updates around the application, including the following:
- We added an explicit quickfilter option to Margin Drivers called "All." Previously, this effect was achieved by having no quickfilter selected.
- Added a loading indicator to the Notifications Pane.
- Removed unneeded whitespace, allowing meaningful content to fill more of the available space in the application.
- Improved performance by reducing the amount of data refreshed when a customer class filter selection is changed on the Home screen.
- Improved the Margin Driver Reason clickthrough experience by directing the user to land on a screen with only data related to what was clicked.
April 15, 2024
Home Screen Refresh
The Home screen has received a number of visual enhancements:
- Consolidated widget layout
- Widgets were given more height, enhancing the visualizations and y-axis granularity
- Customer Class filter support was added to the Customers: Days Since Last Invoice and Active Customers widgets, allowing for filtering directly on the Home screen.
- Color improvements related to accessibility
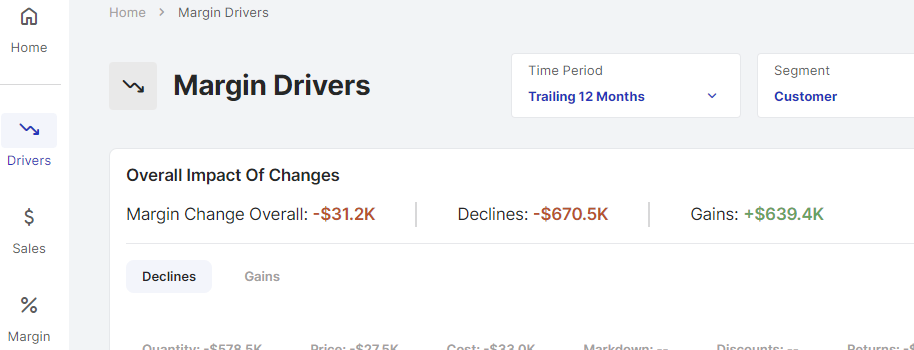
Major Margin Drivers improvements
The Margin Drivers feature has received significant improvements in this release.
-
Redesigned Home Screen Widget
Includes additional information regarding underlying gains/declines
- Information is now presented in a consolidated view, no longer requiring the user to switch between tabs
- Cells are clickable, allowing the user to quickly drill into and evaluate the data behind the numbers they see on the widget. Clicking a cell will take the user to a new landing page with the filters appropriately selected to filter the data based on the context of the cell clicked (e.g. clicking the 'Declines' cell of the 'Quanity' row will result in the user seeing the details screen with the Quanity and Declines quickfilters already selected).
- Enhanced Margin Driver Screen
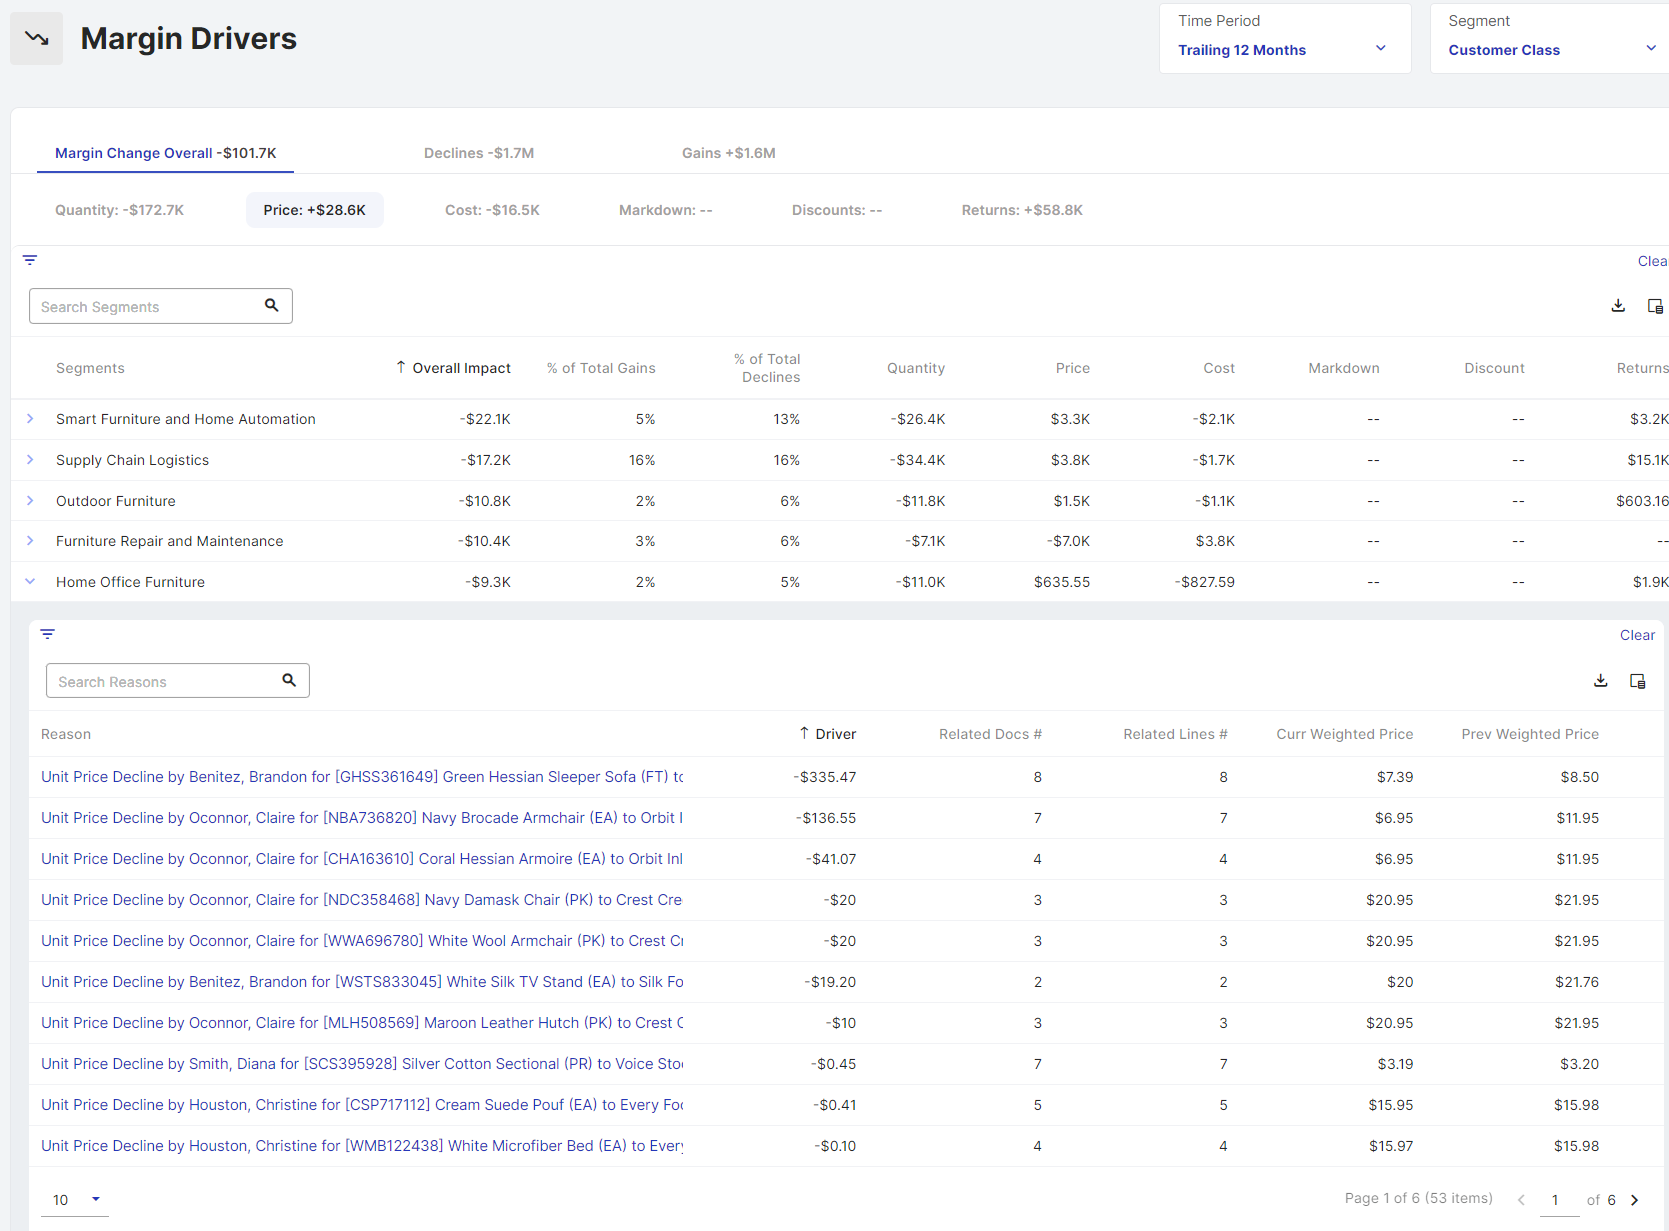
- More intuitive Quickfilters with easy-to-read summary values
- Reasons in the grid now support clicking through to investigate the underlying data.
- More columns and data are available, like previous vs current period comparisons, and the count of lines and documents related to a given reason in the grid.
- Segmenting now groups the Reasons in the grid, allowing the user to see summaries per segment as well as additional data export options.
- The user can now search the Reasons and segment grids independently.
- Reasons now have an icon to the right where AVA Recommendations are made on how a user may want to respond to a reason.
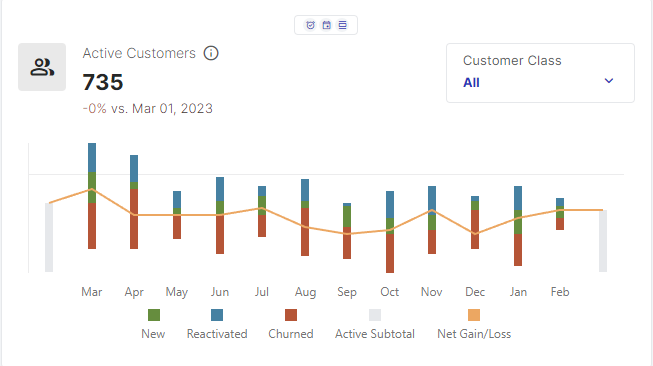
New Major Feature - Customers: Days Since Last Invoice
The Customers: Days Since Last Order functionality assigns a status to each customer based on the time since their last invoice. The status assigned (Recent, Stale, At Risk, or Churned) can be based on customer-definable thresholds configured at the Company level in Profit Analytics. Reach out to Cavallo if you wish to update your company settings for these thresholds.
-
The default thresholds are:
- Recent: <= 90 Days
- Stale: 91 - 200 Days
- At Risk: 201 - 365 Days
- Churned: 365+ Days
- The widget is available on the Home screen and Customer hub.
- An easy-access Customer Class filter is available on the widget in all locations where the widget can be found.
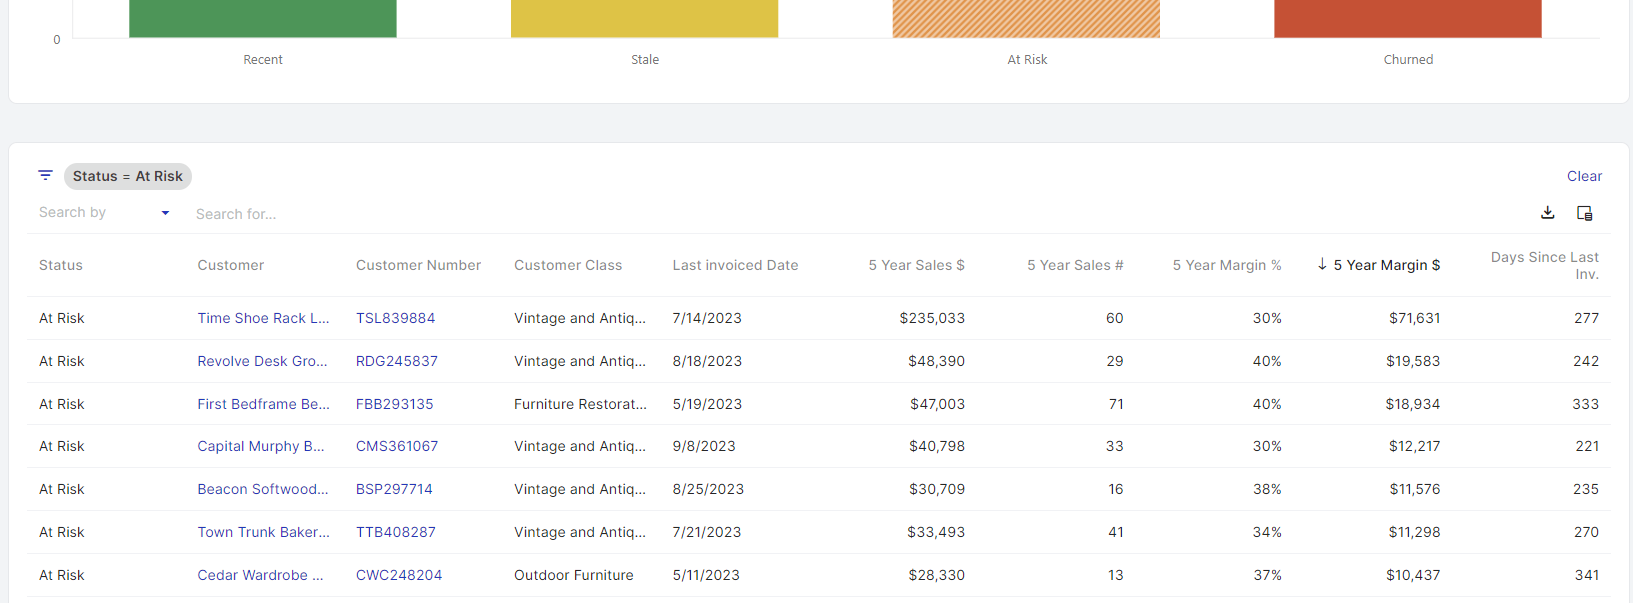
- Clicking the chart allows the user to drill into a details screen where the user can filter, export, and investigate detailed customer data.
- The available data on the detail screen includes 5-year financial values for Sales $, Margin $, and Margin %, allowing the user to pinpoint and prioritize customers they may want to reach out to based on historical sales/margin volume.
- Users can sort/filter based on customer status and create call lists, marketing campaign targets, etc., for their at-risk customers or churned customers, and then share those lists via the Share View feature or by exporting the data to Excel.
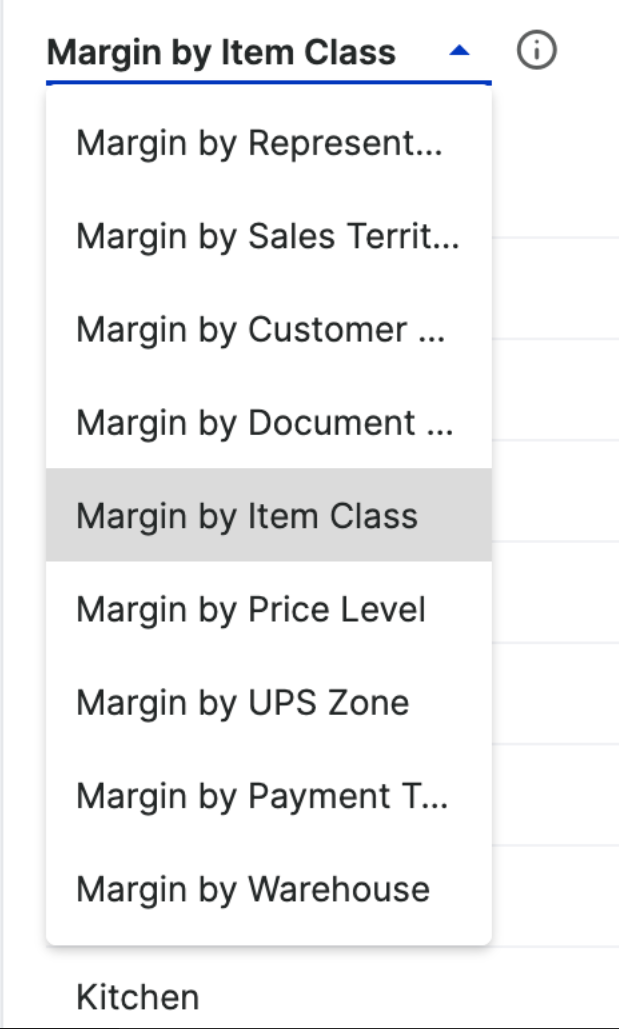
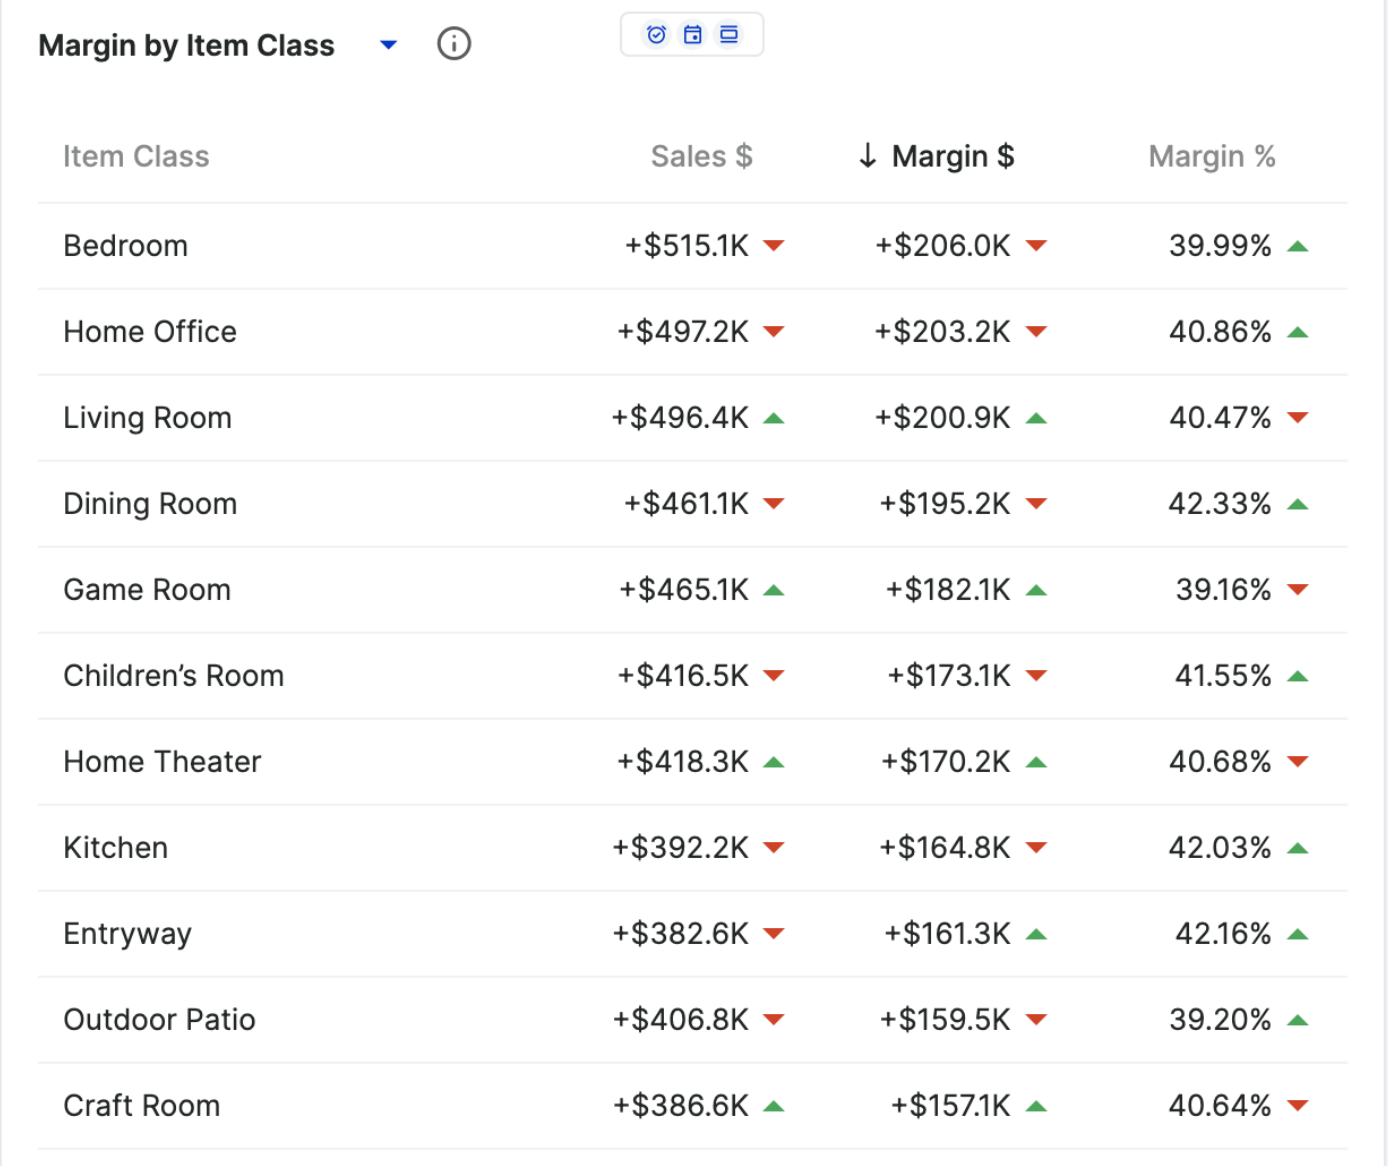
Grid & Segment Support for Item Class
Item Class is now available in grids related to sales line items. It is also available on both the Sales and Margin screens in the 'Segment' by widgets.
PLEASE NOTE: The backend support for this feature will be rolled out over the next week. You may not yet have data to support this feature. We appreciate your patience as we roll this support out.
-
Available Locations
- Items: Top Gainers/Decliners
- Unique Items Sold
- Sales by Item
- Margin by Item
- Sales by Item Class
- Margin by Item Class
Notifications
User-created Notifications, as well as system-created Insight Notifications, are now available in the application. Notifications can be accessed via the bell icon at the top right corner of the application. The number of unseen notifications will appear alongside the bell icon.
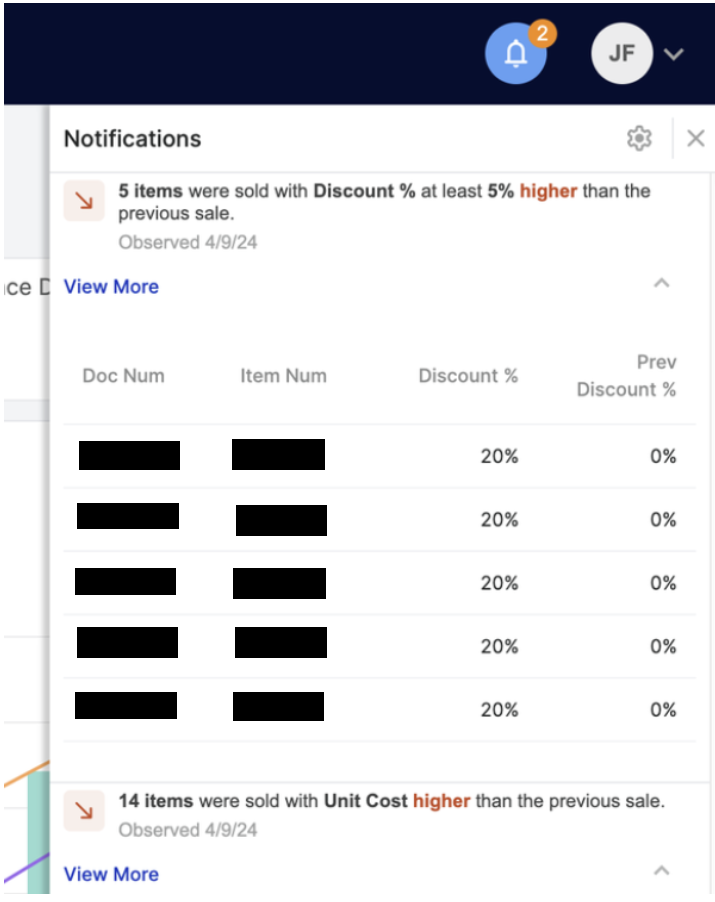
Clicking the gear icon on the Navigation Pane allows the user to create personalized notifications. Notifications are evaluated and sent daily and will persist in the Notification Pane for 72 hours.
The user can create two types of Notificaitons: KPI, and Customer.
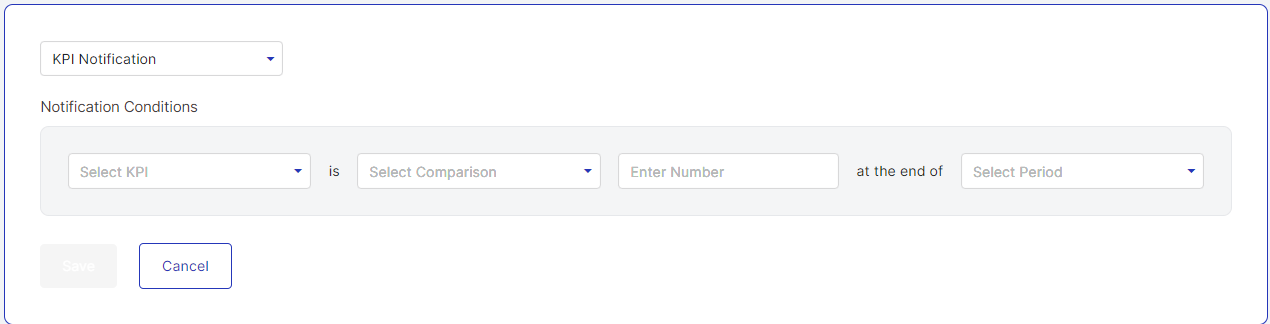
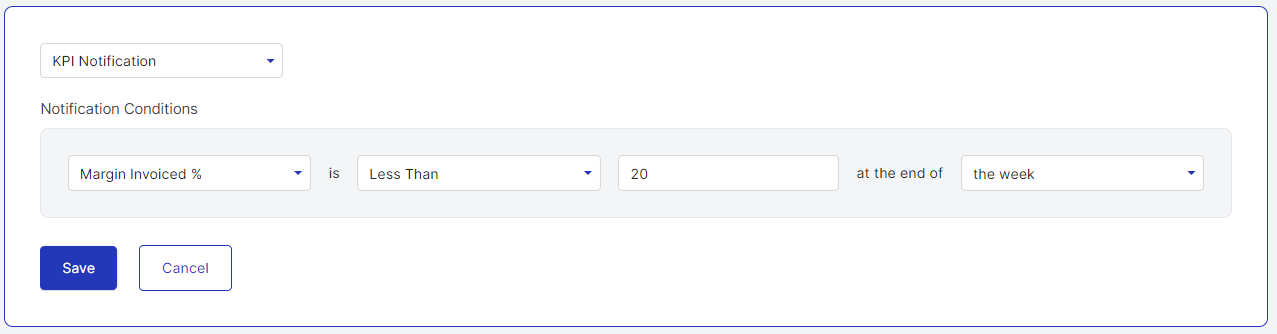
KPI Notifications
KPI Notifications allow the user to configure notifications to be sent in the event a KPI is Greater Than, Less Than, Greater Than or Equal To, Less Than or Equal To a given value at the end of a specified timespan.
-
Supported Options:
- KPIs: Invoices #, Invoice $, Margin Invoiced %
- Comparison: Greater Than, Less Than, Greater Than or Equal To, Less Than or Equal To
- Number: number being compared
- Period: Week, Month, Year
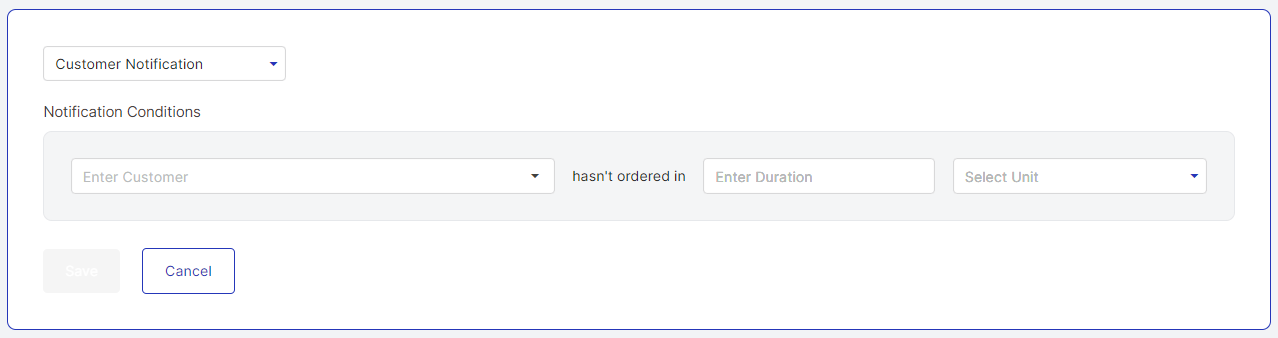
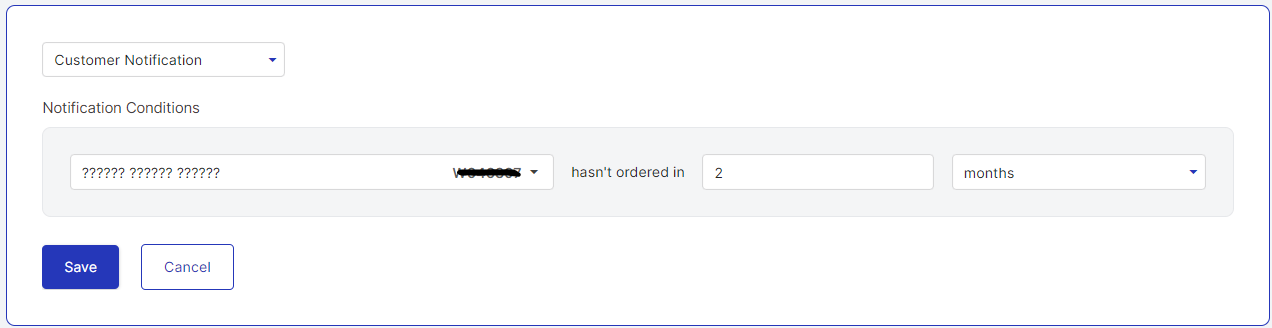
Customer Notifications
Customer Notifications allow the user to specify a notification that will be triggered if a given customer has not had an invoice within a specified length of time.
-
Supported Options:
- Customer: Customer you want the notification to apply to
- Duration: Duration since last invoice
- Unit: Days, Weeks, Months
Other Updates
This version of Cavallo Profit Analytics also includes a large number of fixes and updates around the application, including the following:
- Updated margin drivers export email to include more details information regarding what information was exported.
- Optimized queries and indexes to improve overall data load performance.
- Enhanced background styling for margin drivers.
- Normalized widget title formats on the Home screen
- Reduced widget whitespace, enhancing the size and visibility of the widget's contents.
- Updated various UI components to improve user interface consistency and responsiveness.
- Added new invoice grids, updated icons, and unified the UI to streamline the user experience across the platform.
- Addressed issues with void documents in margin drivers.
- Included unit of measure in chart formatting to prevent overlaps.
- Fixed company selection errors, that sometimes resulted in an error message.
- Added numerous tooltips to improve user understanding and interaction with data.
- Implemented retries for data fetches on errors and updated various configurations to enhance data accuracy and application stability.
- Fixed numeric searches in grids
- Improved default sorting in various grids
- Updated alignment of header cells in segment tiles to ensure data consistency and usability.
March 18, 2024
The Profit Analytics application has been updated. Log into Profit Analytics to see the new major features. Please note that if you already have the application open, you may need to refresh the website for the features to display properly.
Major Features
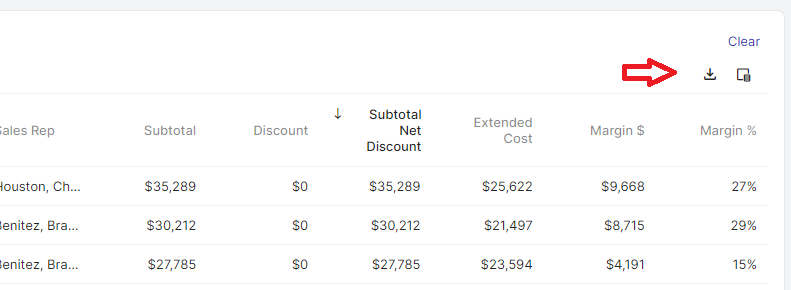
Export to Excel
-
The Export to Excel feature is now available. After clicking the download button on a grid supporting the Export to Excel feature, an Excel file will be generated and a link to download it will be emailed to your account email address.
-
The download link will be active for one hour after being emailed.
-
The Exported file includes column type information, allowing for direct use of Excel functions against the financial and date data in Excel.
Items Navigation Option & Screen
-
There is now an “Items” option in the main navigation bar. Clicking it will take the user to the Items-focused screen where various items-related widgets will be found.
Active Customers
-
The Active Customers widget now has a 'Customer Class' filter. This filter allows the user to filter the visualized data based on Customer Class.
Filter Indicators
-
Filter icons have been added to the screen-level filters as well as the widget headers. The icons on the widgets show as enabled or disabled, indicating whether they support the corresponding filter.
-
If a widget doesn’t support the selected filters, a message will be displayed informing the user which selections that widget supports.

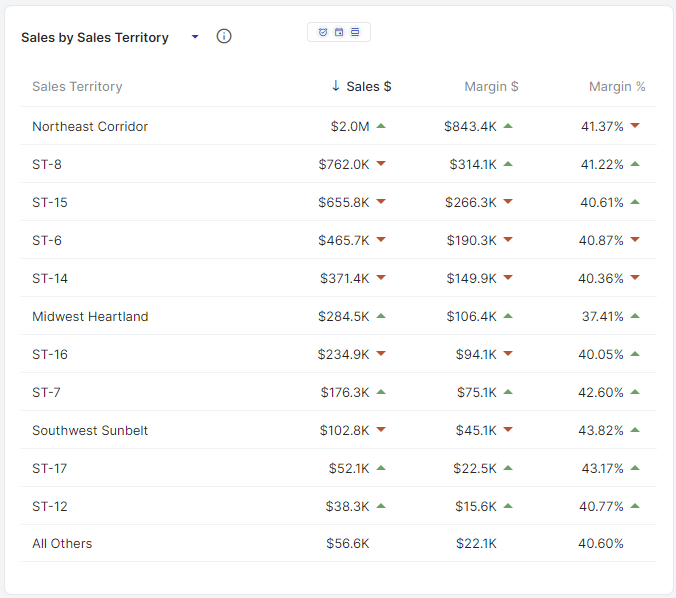
Sales Territory and Warehouse Segment Options
- Sales Territory and Warehouse are now available for the user to select on the Sales and Margin by Segment widgets.
Enhanced Bar Chart Labeling
-
A number of Bar Charts now display stickied labels above four of the charted bars. These four bars represent the minimum and maximum values for each series (current period and comparison period), allowing the charts to convey more key details at a glance.
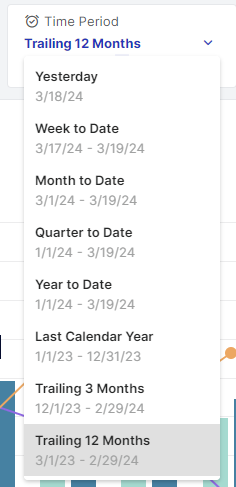
Time Period & Comparison Periods Display the Applied Date Range
-
The user can now see the specific date range a given option will apply if selected.
-
The user can now see subtext within the Time Period and Comparison Period controls displaying the currently applied date ranges, respectively.

Margin Drivers Navigation Option
-
The Margin Drivers feature, a cornerstone feature of Profit Analytics, is now available via a primary navigation option in the navigation bar.
Time Period: Last Calendar Year
-
The option for Last Calendar Year has been added to the Time Period screen filter. Selecting this time period applies a date range that spans the previous calendar year (based on the current Reference Date).
SalesPad URI Linking
-
Document, Customer, and Item grid columns now support URI linking to SalesPad Desktop. Clicking on a cell with one of these three hyperlinked values will now open that document, customer, or item in SalesPad.
NOTE: This feature will only work correctly if you are using a browser on a machine where SalesPad Desktop is installed and has access to the same SalesPad/GP company database your Profit Analytics company is connected to.
Other Updates
-
Sales & Margin Screens
-
The summary info section of the Sales and Margin widgets is now present on all instances of those widgets in the application.
-
The lines on the Margin and Sales widgets that plot the Margin % values over time are now clickable and will take the user to the appropriate details page with a filter applied based on the clicked point.
-
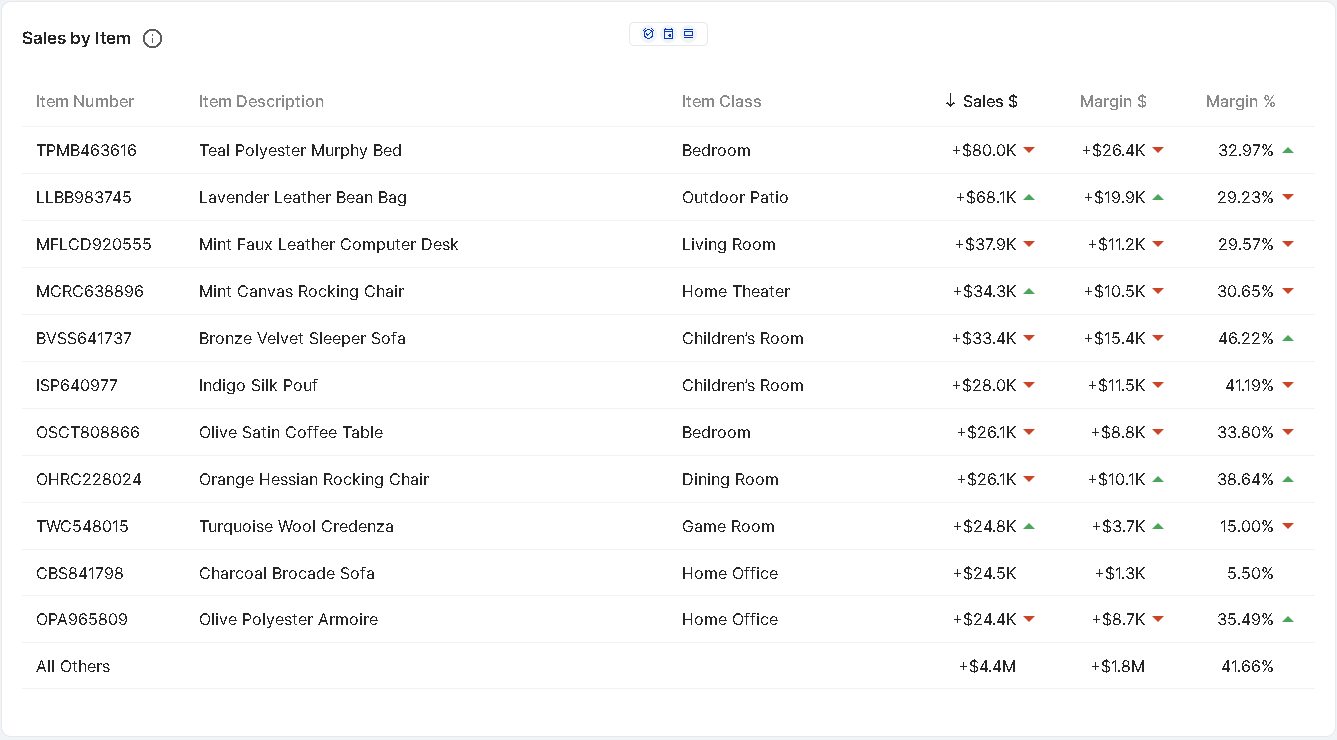
The Sales by Customer and Margin by Customer widgets now display the following additional information: Customer Number, Customer Class.
-
The Sales by Item and Margin by Item widgets have been expanded to better handle long item number and item description values.
-
The “All Others” value, which is included as a row in the grid-based widgets, will no longer be visualized in the corresponding bar chart if the user clicks to access the related details page.
-
-
The item number field has been added in places where only the item description was previously displayed.
-
Queries have been optimized to boost performance throughout the application.
-
Specific widgets will now reload independently instead of requiring the entire screen to reload.
-
The default Time Period selected throughout the application is now 12 Trailing Months
-
Resolved an issue that caused items with UofM’s that had the same value but different casing to be treated as separate items.
-
Updated the application to gracefully handle authentication token failures.
-
Resolved an issue where the wrong comparison period date was shown.
-
Resolved various labeling inconsistencies.
-
Removed visual artifacts and whitespace.
SalesPad Support
Comments