Overview
The Inventory Analysis module allows users to easily view inventory movement, usage, and trends. Users can analyze inventory sales over a specified time frame and make decisions on how to best adjust item resource planning values based on sales averages and months availability. Item resource planning values can be updated manually for individual items or for multiple selected items.
Inventory Analysis data comes from the Data Warehouse tables used by SalesPad and populated by running the sppUpdateDW stored procedure.
Note: For more information on using Inventory Analysis, please contact your Account Manager.
Note: For Inventory Analysis to run properly, and for data to appear in the Item Analysis tab, the SQL Job sppUpdateDW must be running. This stored procedure is available in SalesPad’s Sales Analysis Report documentation. A default warehouse (the warehouse which the user is anticipating to sell from) must also be set on each Customer card in order for customer sales to be reflected in Inventory Analysis. Finally, make sure the shipping information on the sales document is populated.
Table of Contents
Security
In order to allow access to the Inventory Analysis module, Inventory Analysis should be checked in the Security Editor.
Tabs on the lower half of the Inventory Analysis module are each enabled separately in the Security Editor. These tabs are the same as in the Inventory Lookup module and are enabled with the same security settings; refer to the SalesPad Inventory Lookup document to determine which tabs to enable. (If you are already using Inventory Lookup, the same security will apply and you will not have to make any changes to view the tabs in Inventory Analysis beyond enabling the Inventory Analysis module.)
Usage
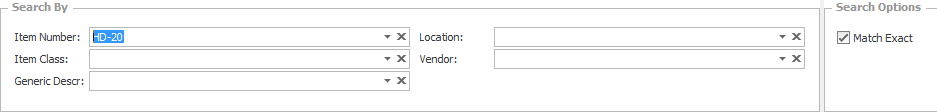
Navigate to Modules > Inventory Analysis. Enter search criteria for the item(s) you want to analyze. You can search by Item Number, Class, Generic Description, Location, or Vendor. Select Match Exact to search for an exact term, or unselect to search for words containing the entered criteria. Click Search or hit Enter.
Note: You can also select values from the dropdowns. Click the down arrow next to either field to view selections.
Results will display in the Search Results grid.
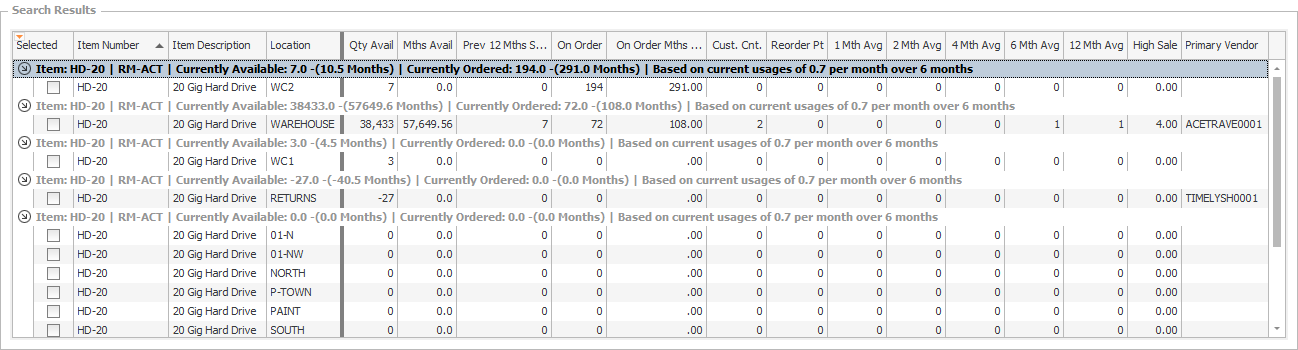
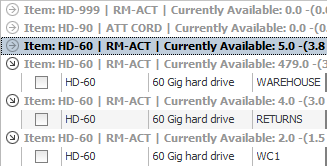
Results are listed by item, displaying the total availability and ordered quantity over all locations on the Item summary line. Each item is then broken down by location, and each location displays on a separate row (click the +/- on the Item summary line to show/hide the breakdowns, or use the Expand All and Collapse All buttons in versions 4.0+ only).
To change the time period being analyzed, use the Time Period dropdown in the upper right of the screen.
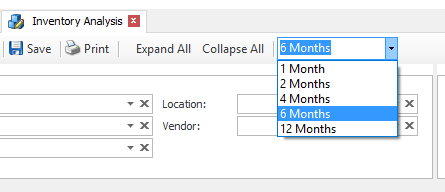
Results will adjust automatically after you make a selection.
Use the Location dropdown to filter which location to toggle (ALL for all).
Note: Only displayed results will be updated. Use the auto-filter row, accessible from the orange triangle in the top left of the grid, to further filter the displayed results.
RESULTS COLUMNS
Quantities are displayed in base unit of measure.
Note: Demand is based on shipments from the default warehouse. Sales from customers who do not have a default warehouse set will not show.
-
The Location column indicates the warehouse/site being analyzed in that row.
-
Qty Avail displays the quantity of avilable stock that has not yet been allocated or fulfilled elsewhere. If the item is on backorder, this quantity may be negative.
-
The Mths Avail column displays number of months' supply available, based on current average usage. It calculates availability based on the rate of use per month (ex. Average 3 items sold per month for 4 months).
-
Prev 12 Mths Sales displays the quantity of the item sold in the past 12 months.
-
The On Order column displays the PO quantity of the item currently on order for that location.
-
On Order Mths Available calculates how many months’ worth are on order, based on the rate of use per month.
-
Cust. Cnt. indicates the number of different customers who have ordered the item.
-
Average item unit sales are displayed across multiple Mths Avg columns, including 1, 2, 6, and 12 month averages.
-
The Allocated column displays the quantity of the item that has been allocated.
-
The OnHand column displays the quantity of the item that is actually currently on hand at the location, which may be different than the quantity available.
-
High Sale displays the quantity of the largest individual sale of the product for that location.
-
Primary Vendor displays the primary vendor for this item at this location.
-
Reorder Pt displays the item’s reorder point in this location. Edit the ReOrder Point Qty Sugg column if you wish to update this value when saving.
-
Max Order Qty displays the item’s maximum order quantity. Edit the Max Order Qty Sugg column if you wish to update this value when saving.
-
Min Order Qty displays the item’s minimum order quantity. Edit the Min Order Qty Sugg column if you wish to update this value when saving.
-
Order Up To Level displays the item’s order up to level value. Edit the Order Up To Level Sugg column if you wish to update this value when saving.
-
Purchase Lead Time is an updatable column than can be saved to update the item's purchasing lead time.
In order to save the changes you’ve made in the Suggested column or Purchase Lead Time column, first, in the rows you wish to update, select the check box that appears in the Selected column, then click Save. The following message will appear:
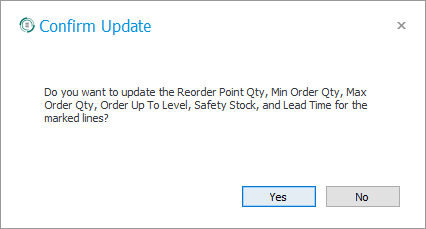
Click Yes.
ANALYSIS TABS
Item-specific information is displayed in the tabs on the lower half of the Inventory Analysis module, based on the row that is selected in the Search Results grid. Click on a row in your results set to view information on that item.
Note: The tabs displayed in Inventory Analysis are the same as those in the Inventory Lookup module. Refer to the SalesPad Inventory Lookup document for more information on the use of each tab.
Note: The Item Inventory Analysis tab displays the same information for the selected item as the Search Results grid displays, but you cannot adjust the reorder point from this tab.
SalesPad Support
Comments