Overview
The SalesPad Sales Analysis Report functionality allows users to pull Raw Sale Data from historical SOP tables and store it in a Data Warehouse. The data presented within this reporting tool is only as current as the last time the "sppUpdateDW" stored procedure was executed. It would be beneficial to execute this stored procedure at the end of every working day to ensure that the reporting data stay current.
Note: The results displayed on this report have the following caveats:
- Data comes from Posted Invoices and Returns, which are netted out
- Data goes off GL Post Date not doc date when using Date Ranges
- Does not include freight
- If using non inventory items, Sales Analysis numbers can become inflated.
Create SQL Job
In order to keep the Data Warehouse updated, you will need to set up a SQL job to ru the procedure every day or week, depending on your preference. WE do not recommend running this procedure during work hours, as it will likely slow down any systems connected to the SQL server.
To create a SQL Job for this stored procedure:
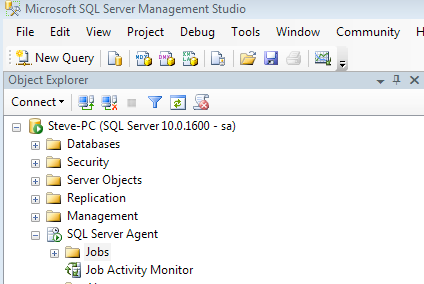
- Open SQL Server Management Studio
- Connect to your company database
- At the bottom of the Object Explorer list you will see SQL Server Agent; click the plus + next to this and right-click on the Jobs folder
- Right-click on New Job
- Enter a name for the job in the window that appears (i.e. Update SalesPad DataWarehouse)
- Go to the Steps page and create a new step
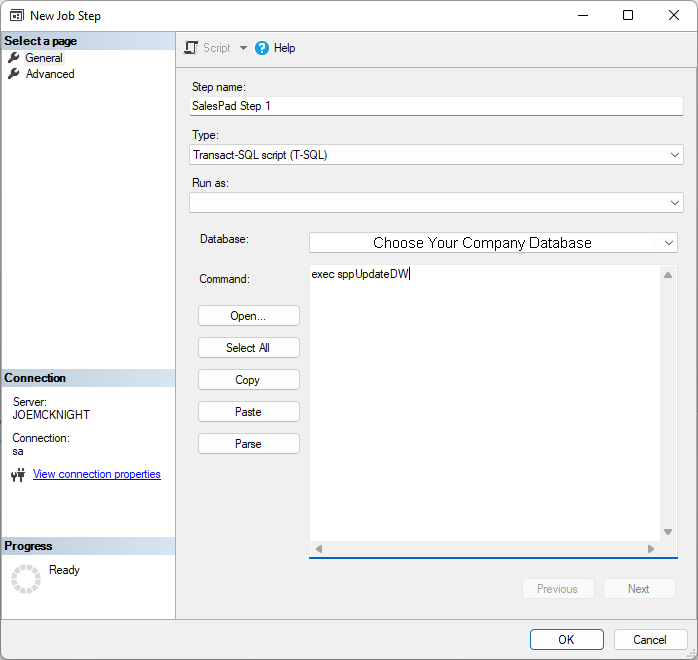
- Name the step, and create with a type of Transact---SQL script (T---SQL). Select your Company Database as the Database.
- In the Command text area, type: exec sppUpdateDW
- Click OK
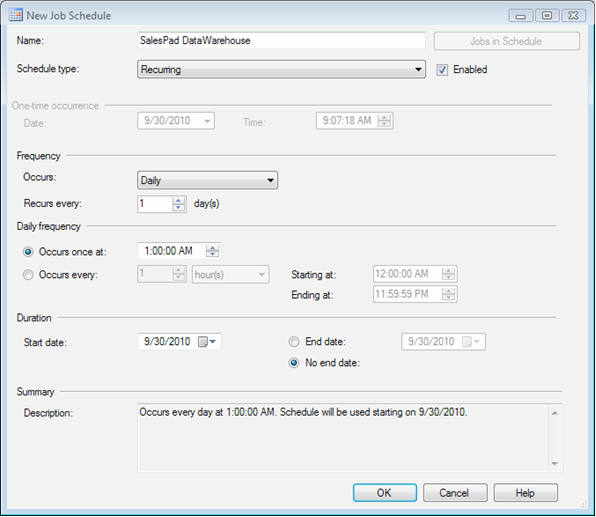
- Click on the Schedules page and click New. From here, select the days and options for when the job should run. SalesPad recommends the job be run at night when users are not in the system, as the processing time can vary depending on the amount of transactions
- From this point you can set up any notifications or alerts. When finished, click OK
Note: The SQL Server Job Agent is not available in the SQL Express editions.
Usage
- Go to Modules > Sales Analysis Report
- Enter an appropriate Start Date and End Date and then click Add
- Click the Refresh button in the header. If the appropriate SQL statement has been recently executed, the Sales Analysis Report will populate with data

Manipulating Fields In the Sales Analysis Report
The buttons on the top row of the Results grid on the Sales Analysis Report are not included in data display below it, but can be added to the grid by dragging and dropping onto the yellow part of the grid:
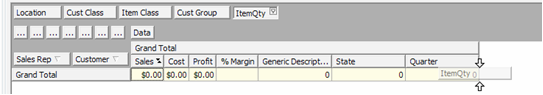
The buttons underneath the top row represent columns that are already part of the grid. You can drag buttons from the lower row to the top row to remove their data from the data display. To rearrange, remove data and re-add it in the desired order.
If you do not see a field in either row, right-click in the gray area to the right of the buttons and select the Show Field List option. The “PivotGrid Field List” window appears. To add items, drag them from this window to the data display or the button rows:
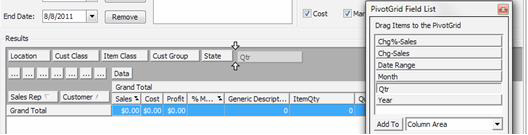
You can also select an item, select a region from the dropdown to add it to, and click Add To.
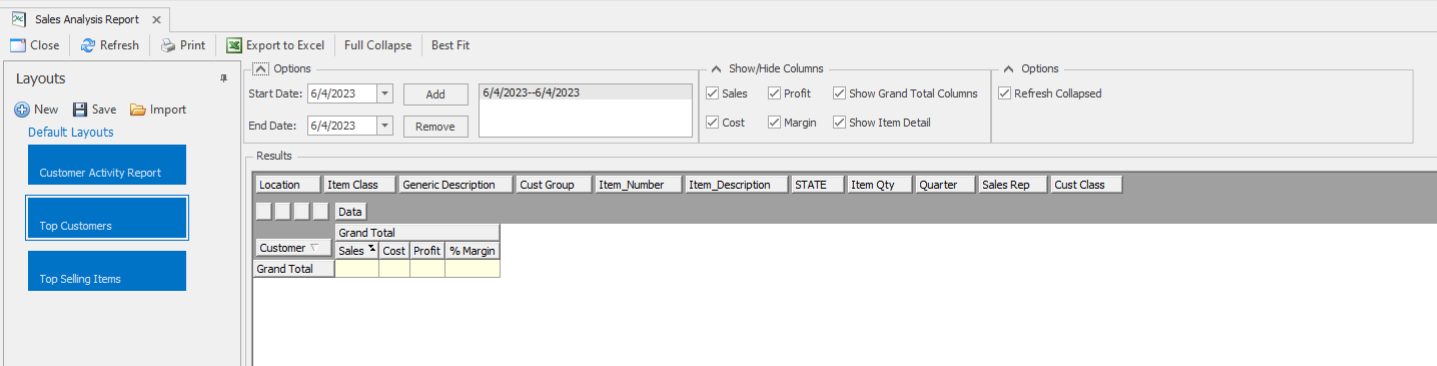
Sales Analysis Report Layouts
As of SalesPad Desktop version 5.2.0 (released February 2021) the Sales Analysis module has received improvements similar to those of our Quick Reports module, so that once a Sales Analysis pivot report is configured and arranged as a user prefers, the Layout can be saved into the company database and accessed by other users to quickly view the Sales Analysis Report data with a consistent layout.
*A Layout still requires a user to provide values under the Options section such as Date Ranges, then Refresh the report.
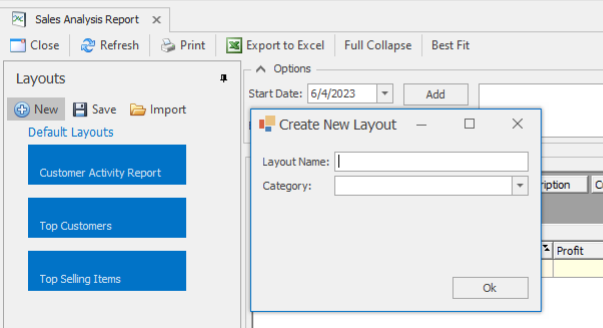
Creating a New Sales Analysis Layout
- Click New and provide a name for the Sales Analysis Report Layout and optionally type or select from the drop-down a Report Category. Report Categories are useful for grouping similar Sales Analysis Report Layouts.
- Organize the data in the Results Grid as you would like to have the data displayed by dragging and dropping the various Sales Analysis Report columns.
- When done, click Save.
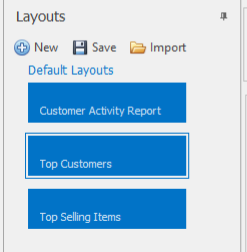
Opening a Sales Analysis Layout
- Left-click on a Sales Analysis Report Layout. The Results grid will adapt to the selected report layout.
- Add Date Ranges and other Report Options and click Refresh to view the data.
Report Layout Options
Moving the mouse cursor over a User-Created Sales Analysis Report Layout provides visibility to a report layout's options, from left to right:
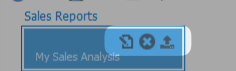
- Edit Layout Category - move the Layout to another Layout Category
- Delete Layout - delete the Sales Layout from Sales Analysis
- Export Layout - export the Layout file to a backup .layout file.
Security
Sales Analysis Report* - Enables the security group to open the Sales Analysis Report module in SalesPad.
Settings
Allow Export to Excel - Allows Sales Analysis data to be exported to Microsoft Excel. Defaults to True.
Allow Screen Layout Customization - Enables users to customize the Sales Analysis Layout screen. Defaults to False.
Can View Cost - Allows users to view cost in Sales Analysis reports. Defaults to True.
Can View Margin - Allows users to view margin in Sales Analysis reports. Defaults to True.
Default Layout Folder - legacy Sales Analysis Report network folder where Layouts are stored.
Excel Export Mode -How Sales Analysis Report Data is handled during Export to Microsoft Excel. Defaults to DataAware.
- DataAware provides data formatting options ideal for pivot reports
- WYSIWYG provides data as static data columns and disables data shaping options
Export To Excel Data Type - toggle between data types Text and Value when report data is exported. Defaults to Text.
- Text - Excel data columns are formatted as Text
- Value - Excel data columns are formatted as corresponding data in the report (numeric, datetime, etc.)
Limit to Current User's Sales Rep - Filter all Sales Analysis reports run by the current user by the Sales Rep the user is associated with in Security Editor. Defaults to False.
Show Default Layouts - When Enabled, users can view and select from Default Sales Analysis Layouts
Alternative sppUpdateDW for Non-Inventory Items
Starting with 5.2.8.
There is now an alternative stored procedure provided, sppUpdateDW_IgnoreNonInvDescription. This stored procedure may be used in the event that there are numerous non-inventory items used that have their sales line description change often.
Examples of where you may need to use this alternative stored procedure:
- Notice duplicate data in Sales Analysis for certain items.
- If there are duplicates, the first place to check to confirm that you have this problem is the dwItem_dim table. The following SQL can be ran to verify this.
- The normal stored procedure takes an excessive amount of time to run. This is a good sign that there are numerous item descriptions per non-inventory item.

What to do:
- The data warehouse table will need cleared out if they are populated. This can be done in through the SQL Custom Procedures screen and the Clear Data Warehouse button.
- Rename the sppUpdateDW_IgnoreNonInvDescription to spcpUpdateDW. This way the base sppUpdateDW will call the spcp version and no additional changes will be needed.
- Update the Data Warehouse.


Note: Re-running the sppUpdateDW should be ran after hours when nobody is in the system to prevent any system slow down issues.
SalesPad Support
Comments