Overview
The SalesPad Dashboard Designer harnesses the power of the DevExpress Dashboard functionality to give users new and powerful tools to visualize company data. DevExpress offers extensive documentation on all the advanced capabilities of the Dashboard, both on their website and as a video series on YouTube.
This document will cover Creating, Saving, and Importing Dashboards within SalesPad, as well as the basics of manipulating data.
Installation
The SalesPad Dashboard Designer and Dashboard Viewer is included with all standard SalesPad installations of version 4.3.1 and newer.
The Dashboard Maintenance screen is included in version 4.3.2 and newer.
Security
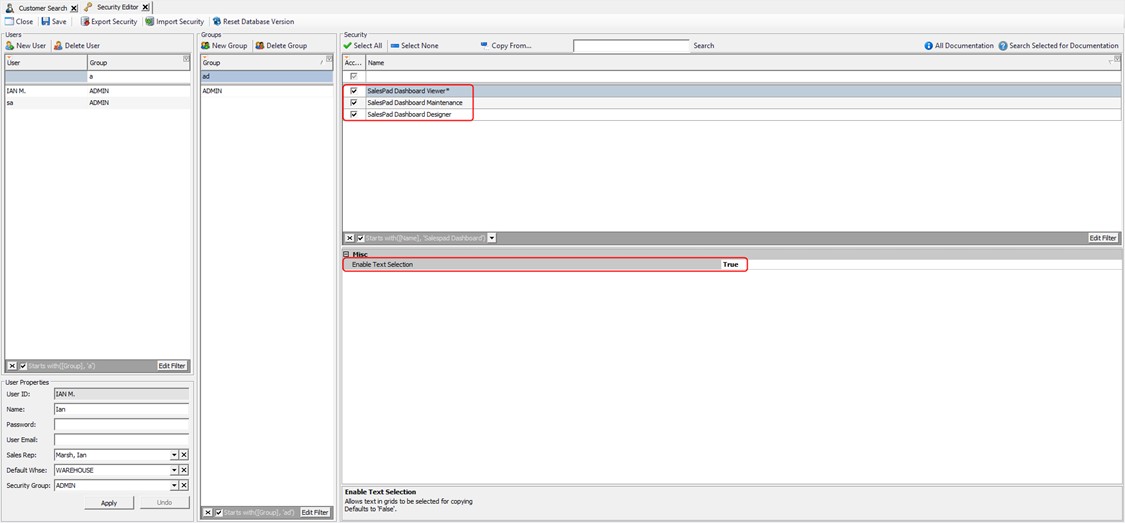
In the SalesPad Security Editor (Modules > Security Editor), filter to *SalesPad Dashboard to enable the plugin functionality.
The Dashboard Viewer contains a setting, Enable Text Selection. Setting this to True will allow the user to copy text from grids on the dashboard.
Usage
Creating a new Dashboard
To create a new Dashboard, click the Add button on the Dashboard Maintenance screen. The user will be prompted to enter a name for the new Dashboard. Enter the name and click OK.

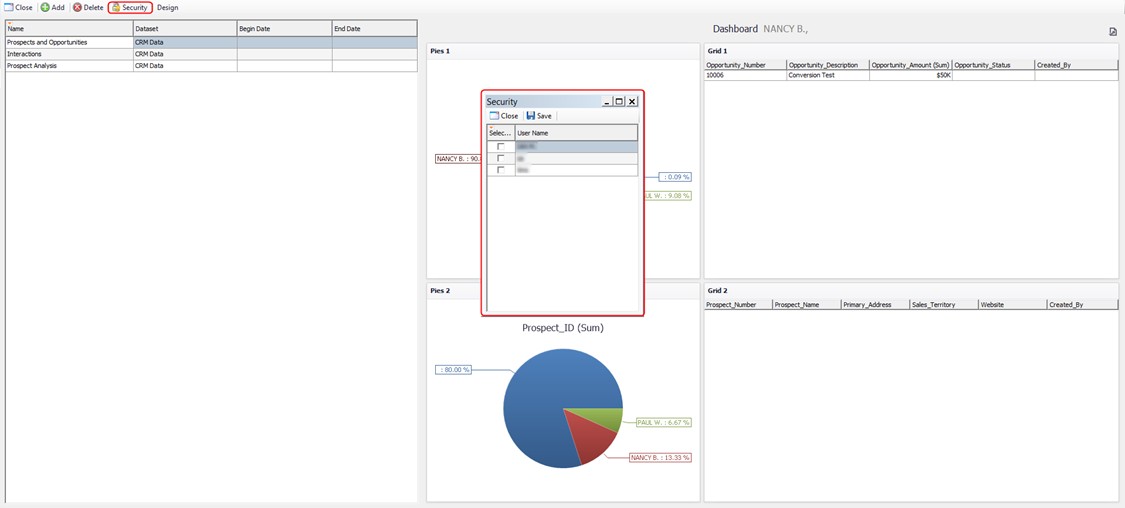
You must allow access to the users you wish to see this Dashboard through the SalesPad Dashboard Viewer. To do this, select the Dashboard from the list on the left side of the screen and click Security. In the popup window, select the users that need access to the Dashboard. Next, click Save and then Close.
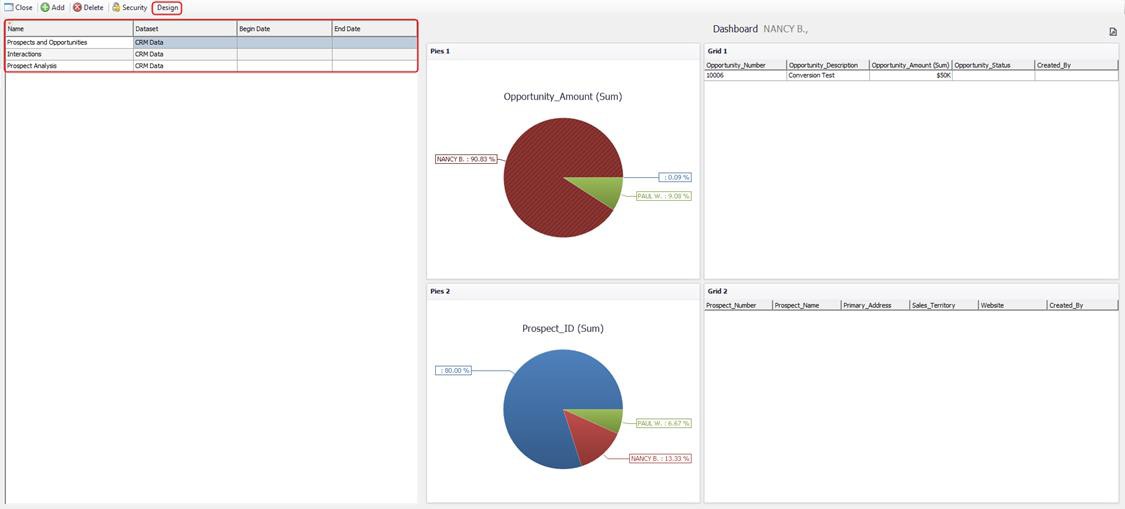
You must select the dataset you want to be included by default with the dashboard. Each dataset will automatically load in a set of data tables, pre-populated with the data from the company SalesPad is connected to. You can also select a beginning and end date, which will be used when the dataset is loaded, bringing in only the data that lies between those two dates. If no dates are chosen, all data will be loaded (This can cause performance issues). To begin building the dashboard, click Design.
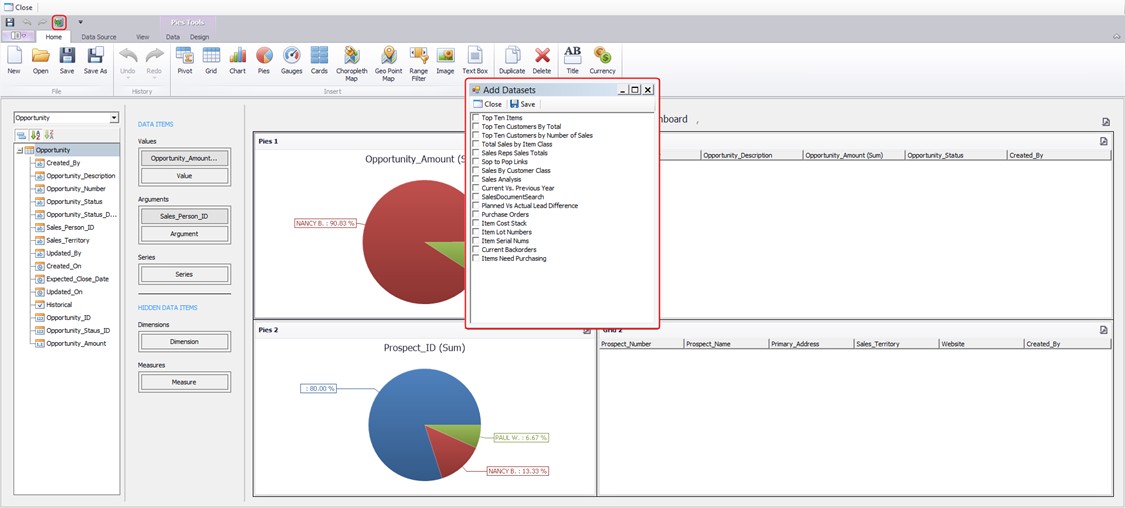
Now, you are ready to begin adding data to the Dashboard. The SalesPad Dashboard comes pre-loaded with a number of datasets ready to use out of the box. To access these datasets, click on the Add Datasets button. This will bring up a window with all the available datasets. Select the datasets you wish to use on the dashboard, and click Save. New datasets can be added by clicking on the Data Source tab of the ribbon and selecting New Data Source. Follow the instructions in the wizard to create the new data source. Once it is created, you will be able to use that data on your Dashboard.
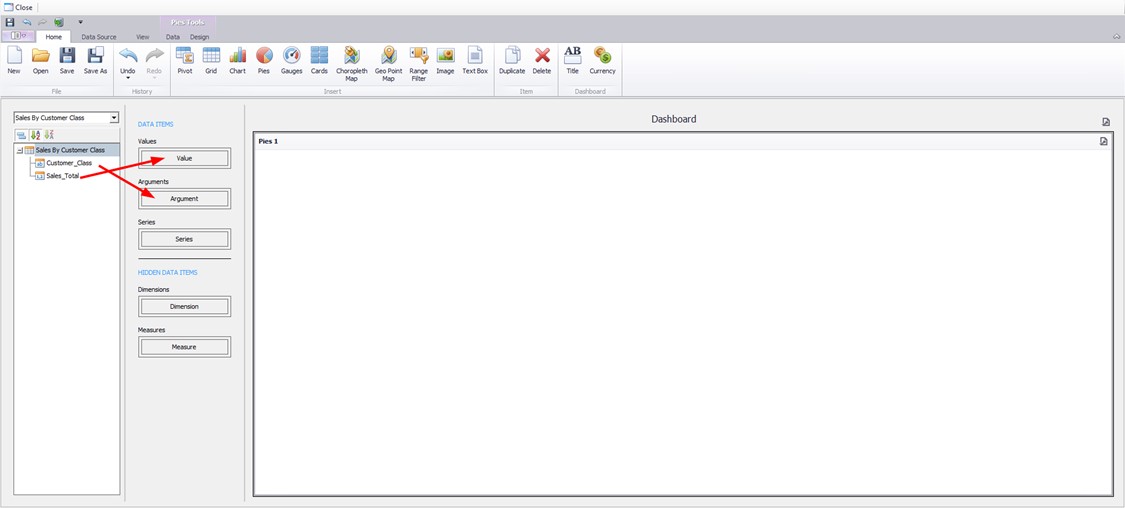
Select a control from the Home tab of the designer, and a blank container will be added to the Dashboard. Next, select the data source you wish to display using the new object. Simply drag the data members you wish to see from the field list to where you wish to see them in the dashboard (in the Data Items area).
Saving an existing Dashboard
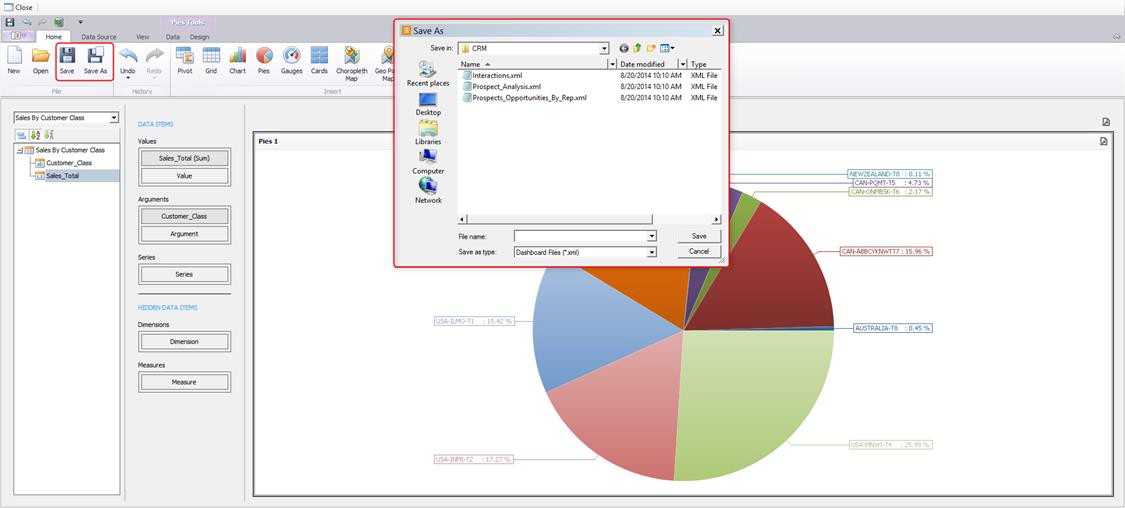
Clicking the Save button on the ribbon of the Dashboard Designer will save the dashboard layout to your SalesPad database, allowing users with the proper security to access them in the Dashboard Designer and/or Dashboard Viewer, depending on the particular user’s security permissions.
Clicking the Save As button will bring up the standard Windows save prompt, allowing you to output the Dashboard to an XML file.
Loading an existing Dashboard
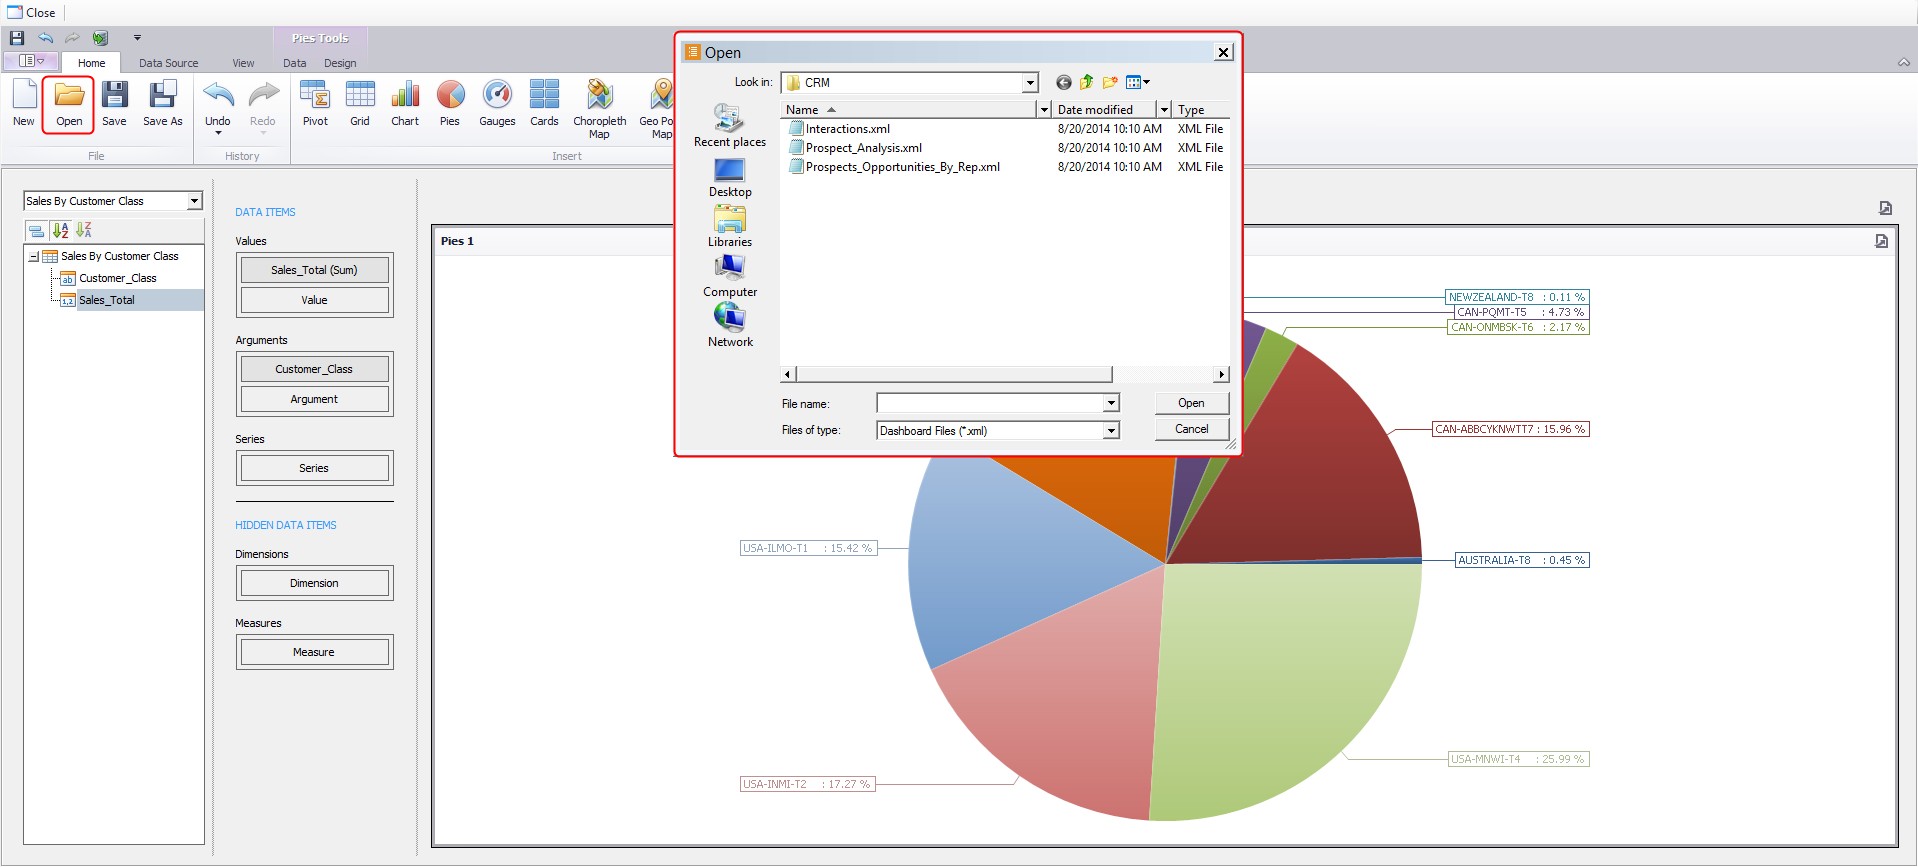
Just as you can save Dashboard layouts to an XML file, it is also possible to load in a dashboard from a provided XML file. Simply click Open from the Dashboard Designer ribbon, select the Dashboard you wish to load, and click Open. This will add a new Dashboard to the grid on the left of the screen, using the name of the file as the Dashboard name.
Note: Dashboard security is not saved to or loaded from the XML files. You will still need to save the dashboard to the database and set individual user access.
SalesPad Support
Comments